k
j
![]()
Dynamic Opacity Optimization for Scatter Plots
Abstract
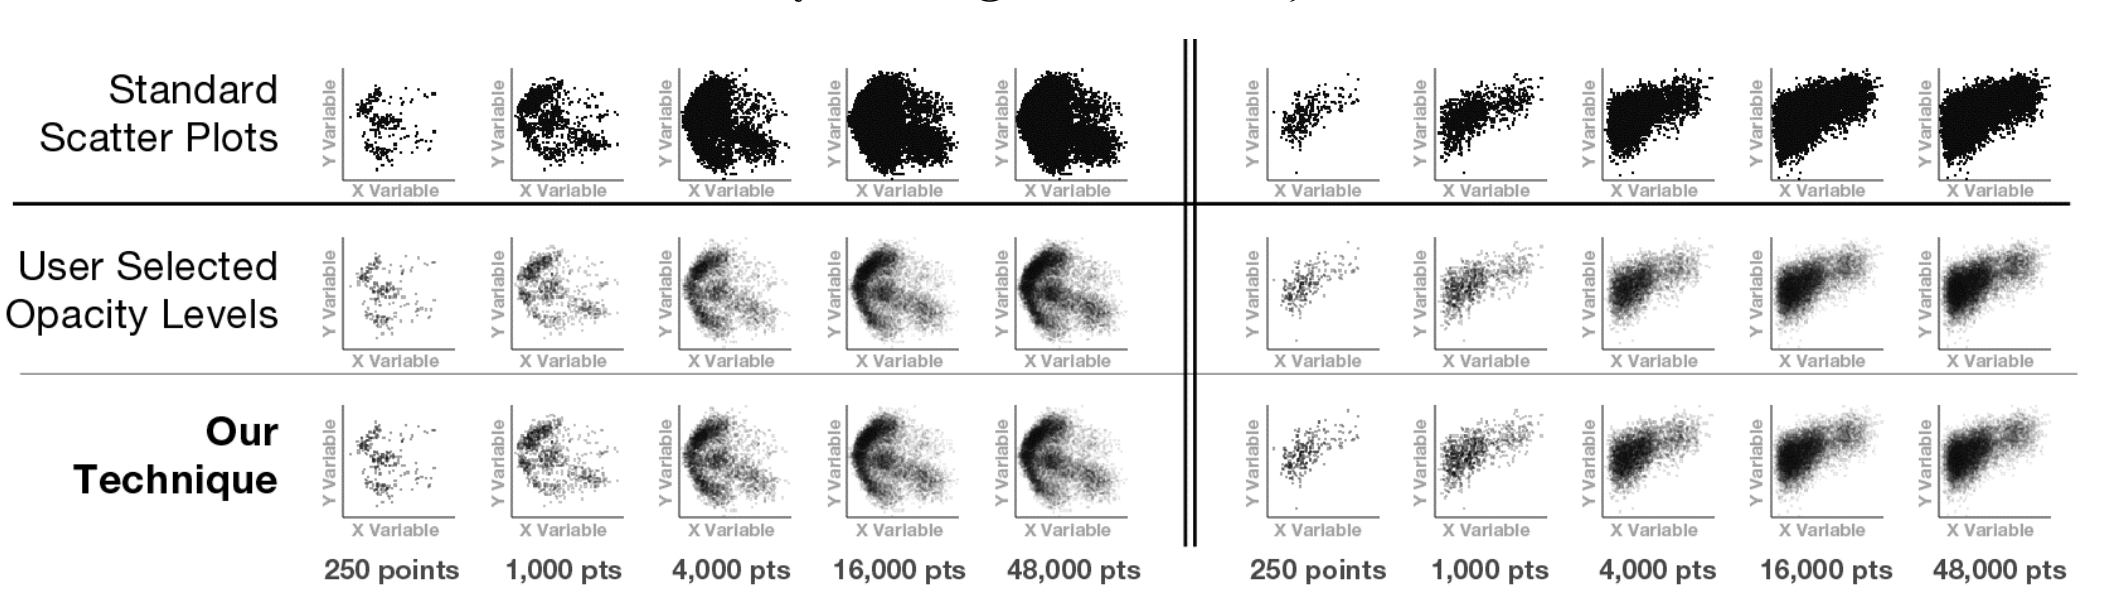
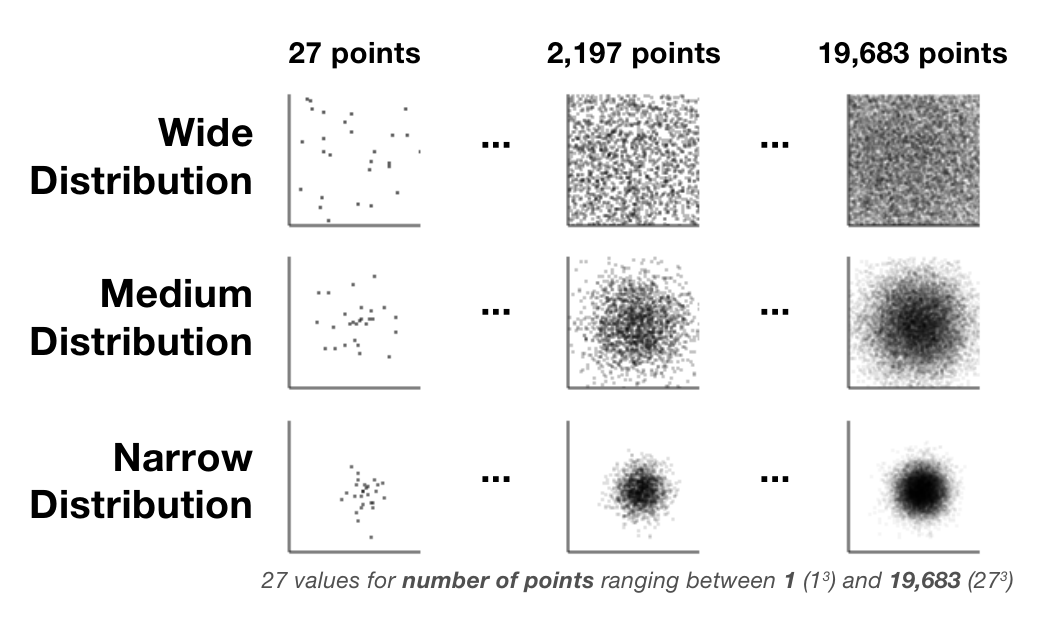
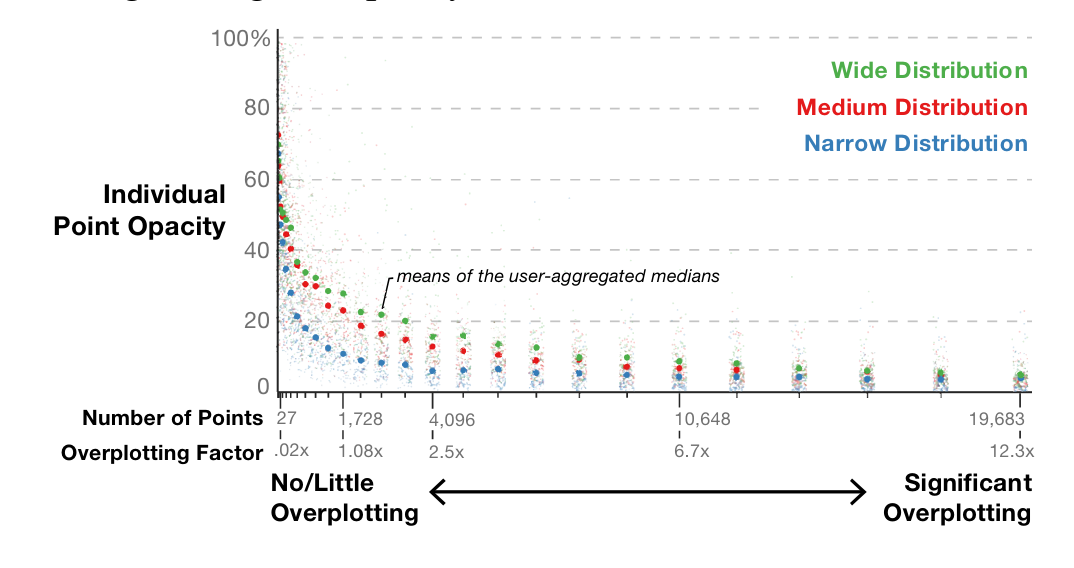
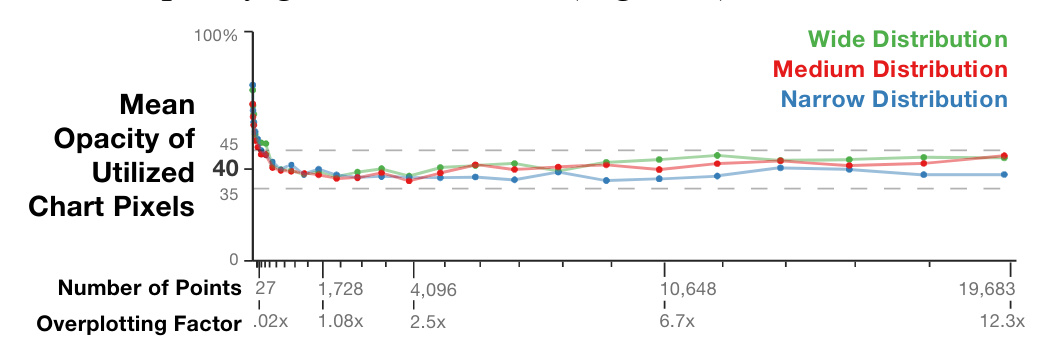
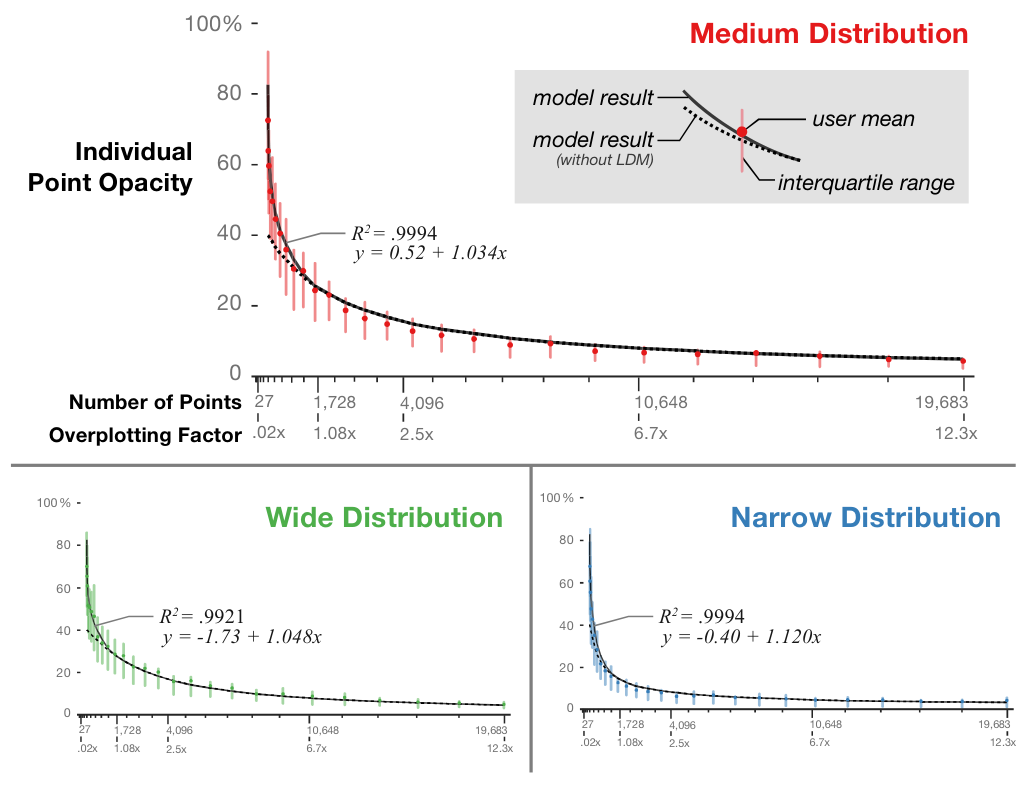
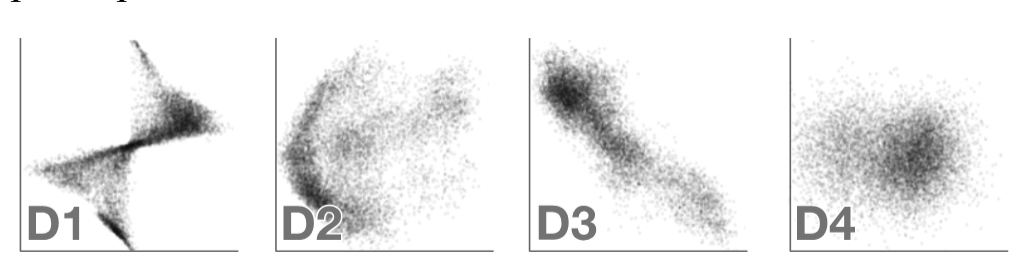
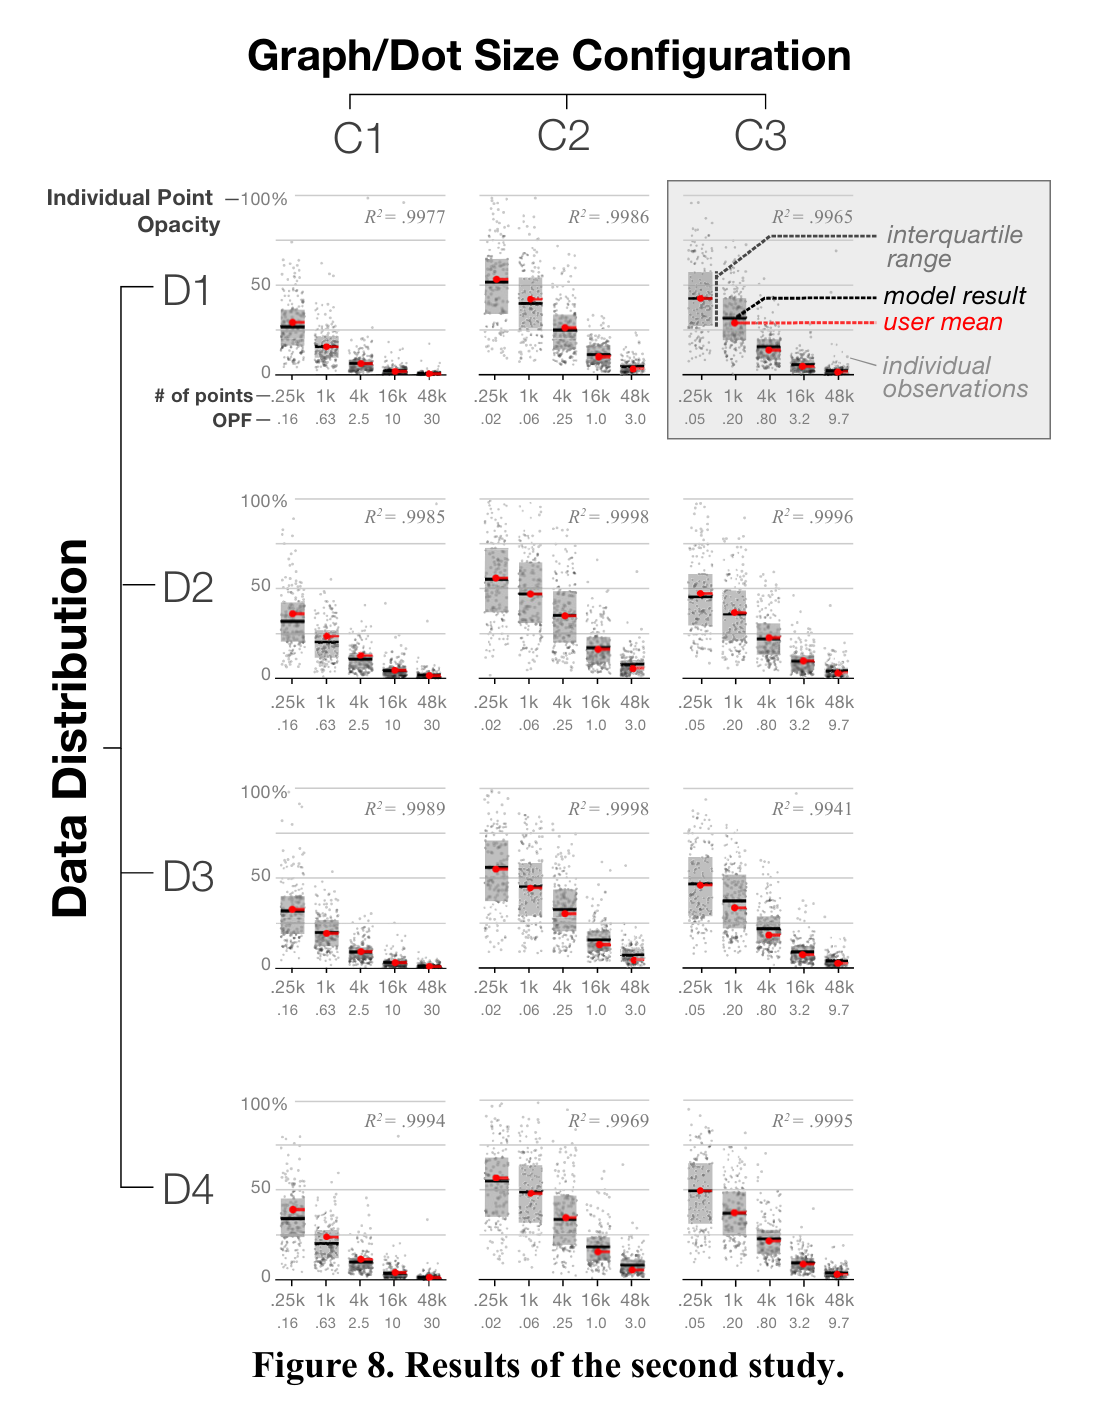
Scatterplots are an effective and commonly used technique to show the relationship between two variables. However, as the number of data points increases, the chart suffers from \"over-plotting\" which obscures data points and makes the underlying distribution of the data difficult to discern. Reducing the opacity of the data points is an effective way to address over-plotting, however, setting the individual point opacity is a manual task performed by the chart designer. We present a user-driven model of opacity scaling for scatter plots built from crowd-sourced responses to opacity scaling tasks using several synthetic data distributions, and then test our model on a collection of real-world data sets.
Figures
BibTeX
@inproceedings{10.1145/2702123.2702585,
author = {Matejka, Justin and Anderson, Fraser and Fitzmaurice, George},
title = {Dynamic Opacity Optimization for Scatter Plots},
year = {2015},
isbn = {9781450331456},
publisher = {Association for Computing Machinery},
address = {New York, NY, USA},
url = {https://doi.org/10.1145/2702123.2702585},
doi = {10.1145/2702123.2702585},
abstract = {Scatterplots are an effective and commonly used technique to show the relationship between two variables. However, as the number of data points increases, the chart suffers from "over-plotting" which obscures data points and makes the underlying distribution of the data difficult to discern. Reducing the opacity of the data points is an effective way to address over-plotting, however, setting the individual point opacity is a manual task performed by the chart designer. We present a user-driven model of opacity scaling for scatter plots built from crowd-sourced responses to opacity scaling tasks using several synthetic data distributions, and then test our model on a collection of real-world data sets.},
booktitle = {Proceedings of the 33rd Annual ACM Conference on Human Factors in Computing Systems},
pages = {2707–2710},
numpages = {4},
keywords = {visualization, scatter plots, overplotting, opacity},
location = {Seoul, Republic of Korea},
series = {CHI '15}
}