k j

Skyglyphs: Reflections on the design of a delightful visualization

Bon Adriel Aseniero, George Fitzmaurice, Sheelagh Carpendale, Justin Matejka
January 2022 · 2022 IEEE VIS Arts Program (VISAP)

Abstract

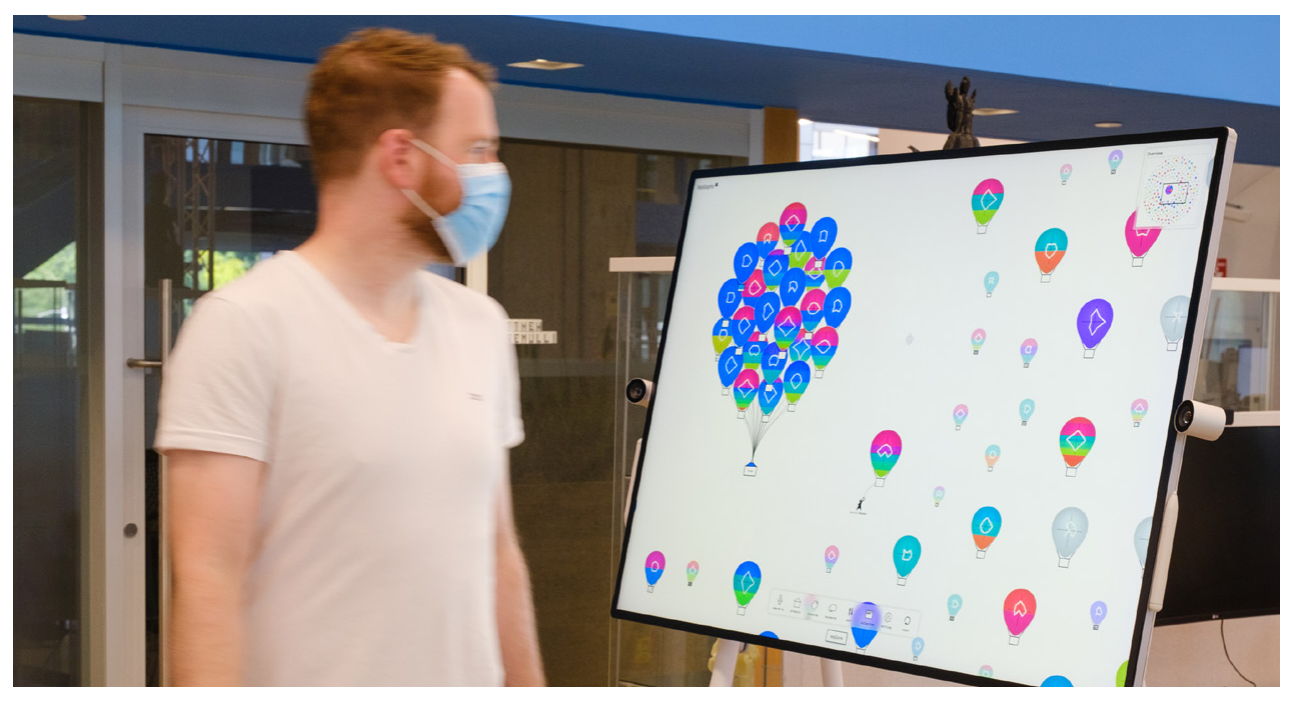
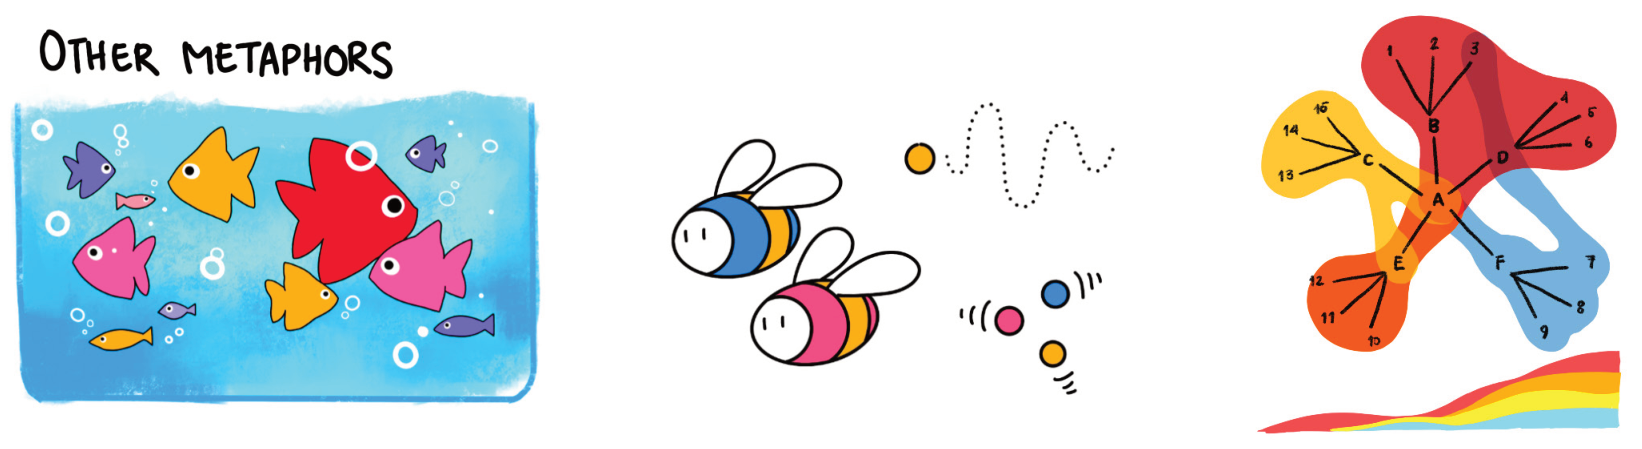
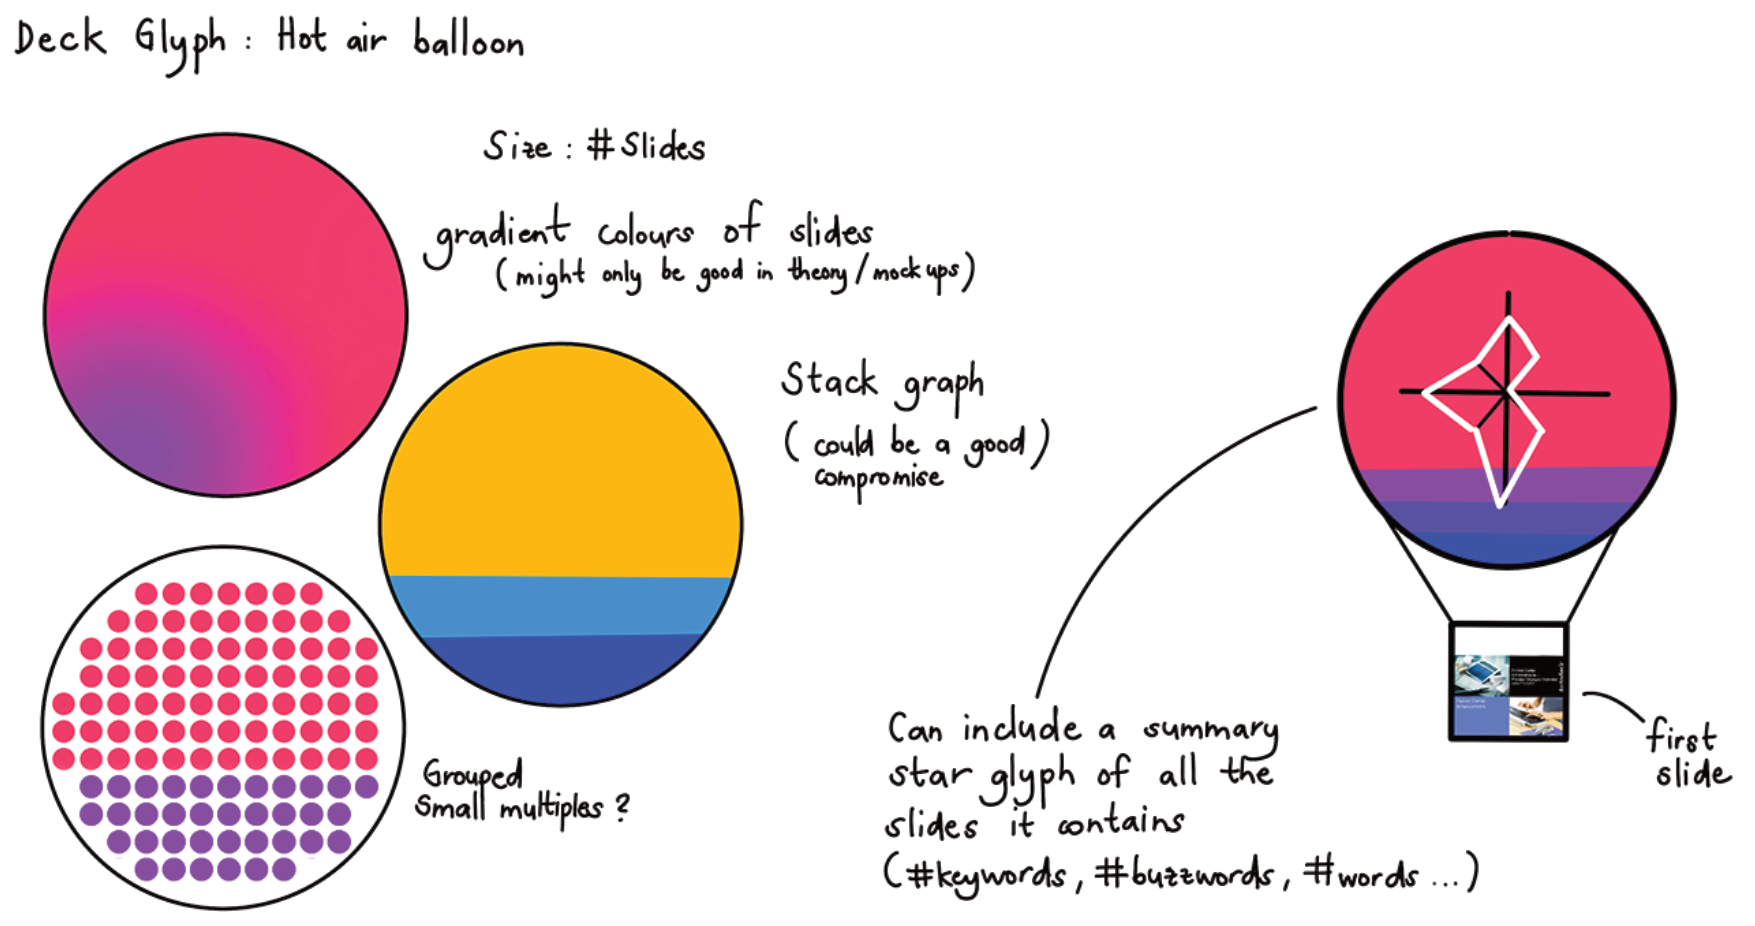
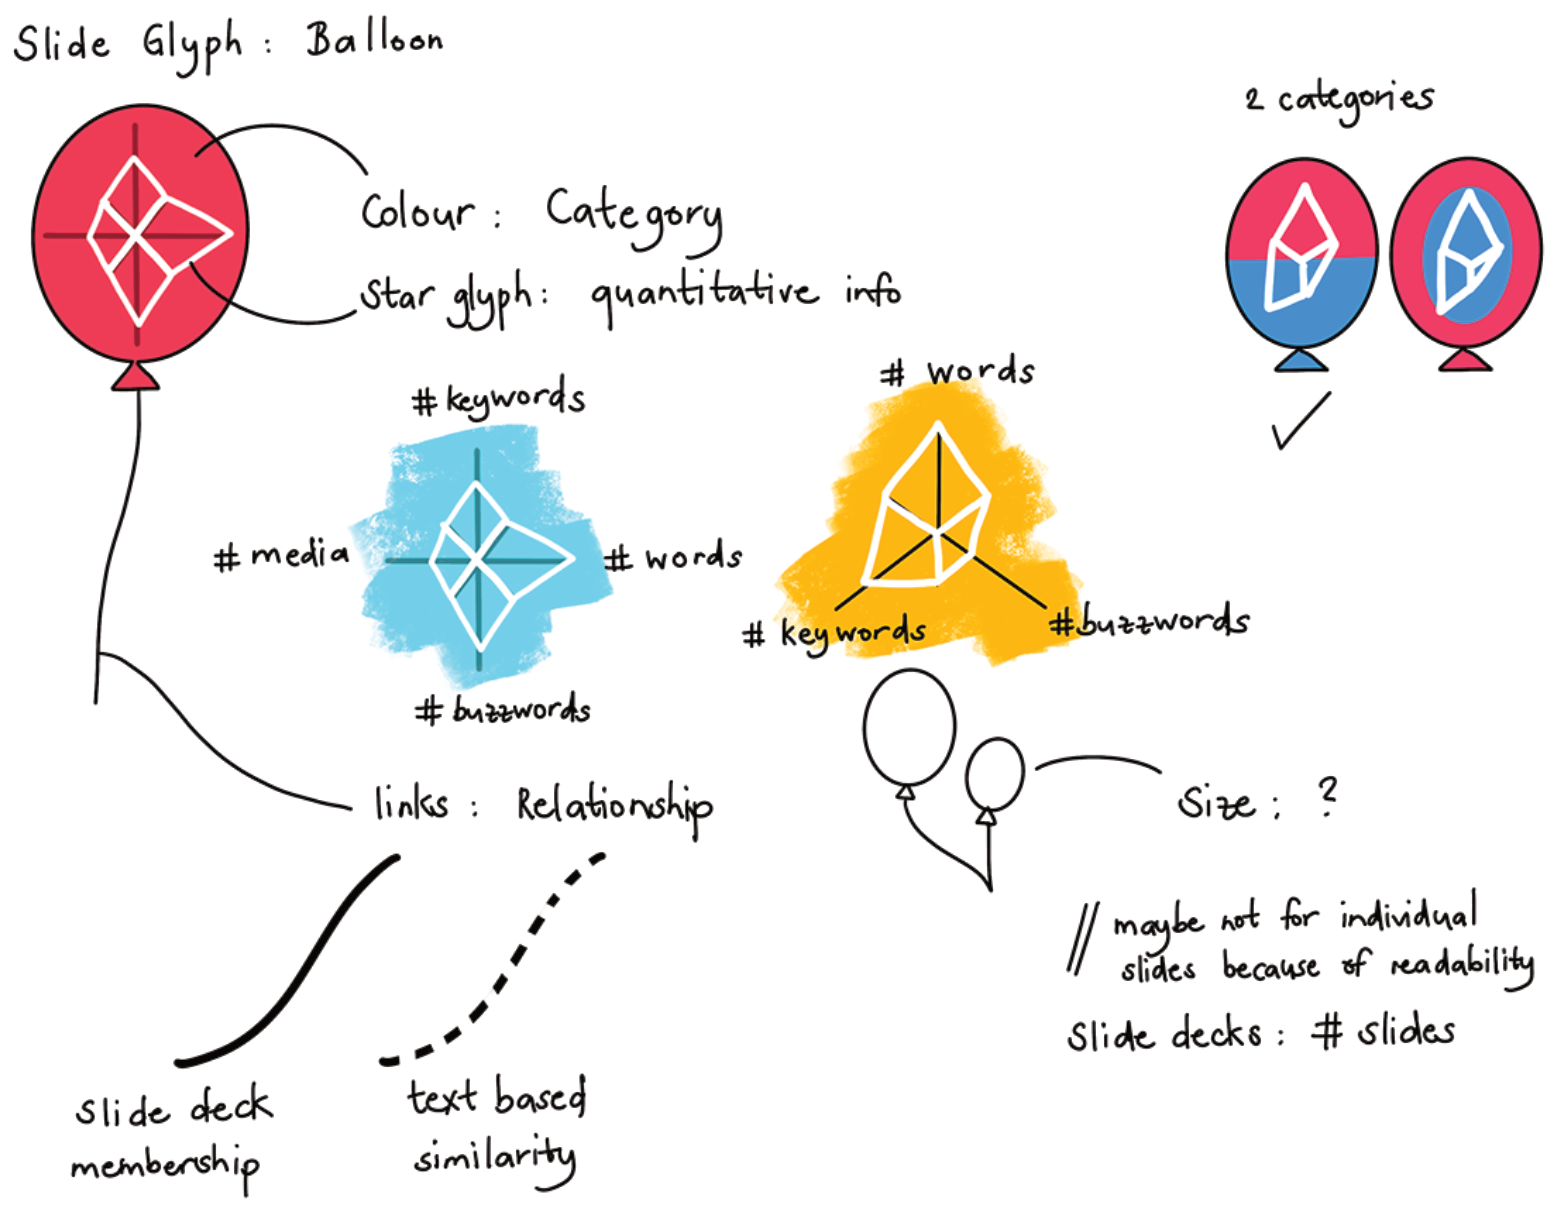
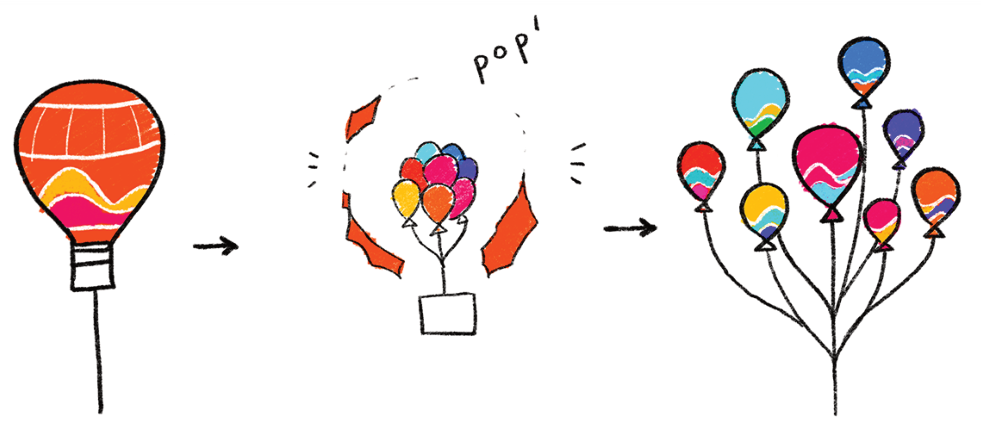
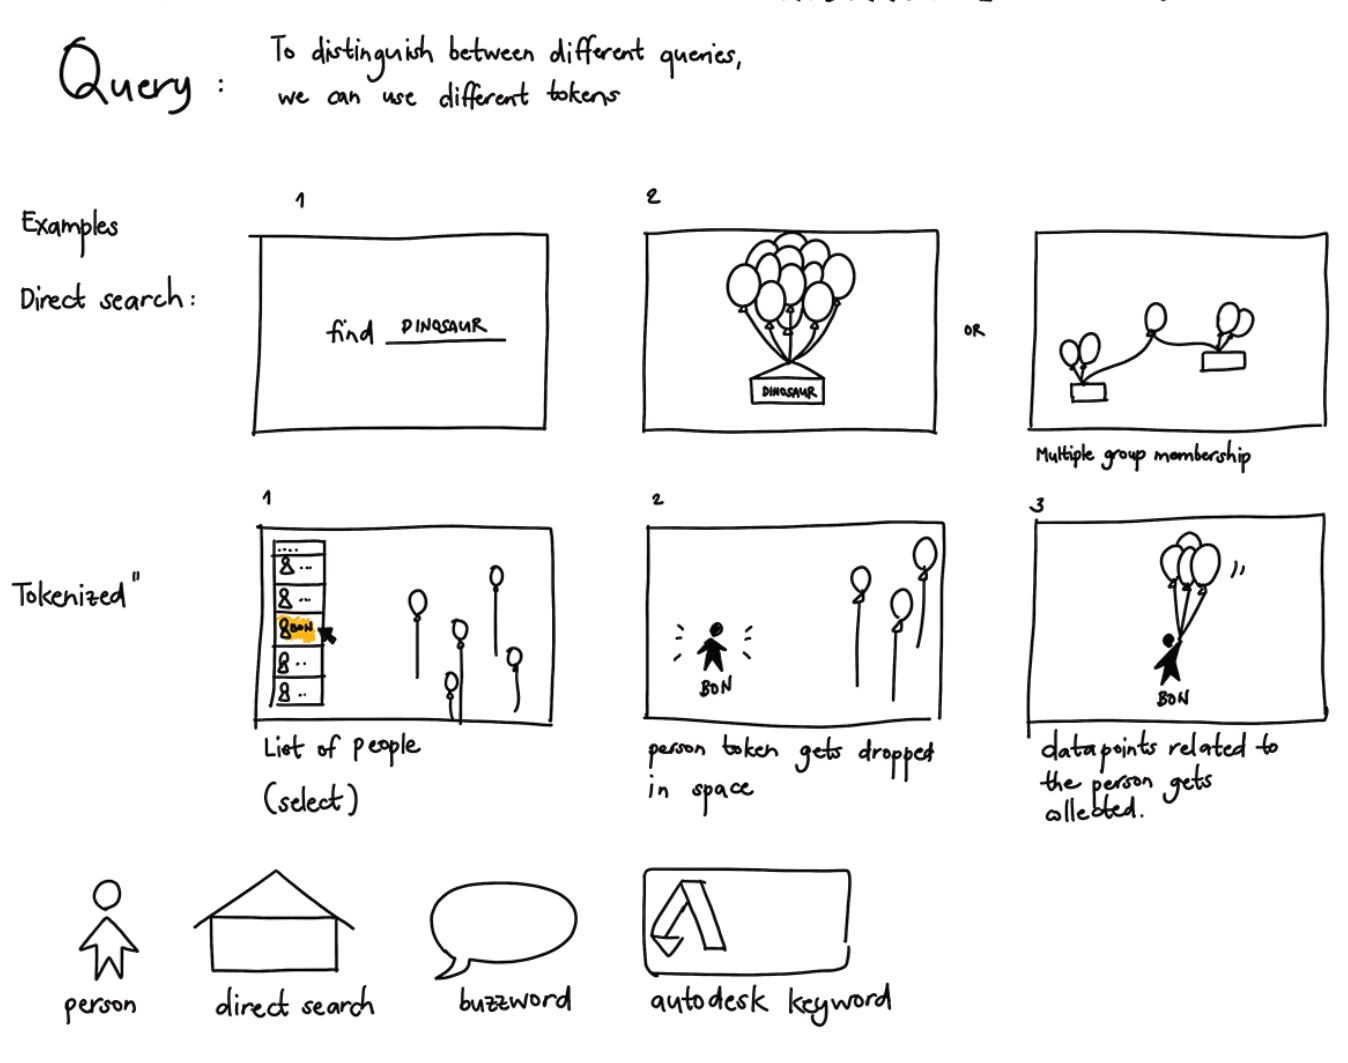
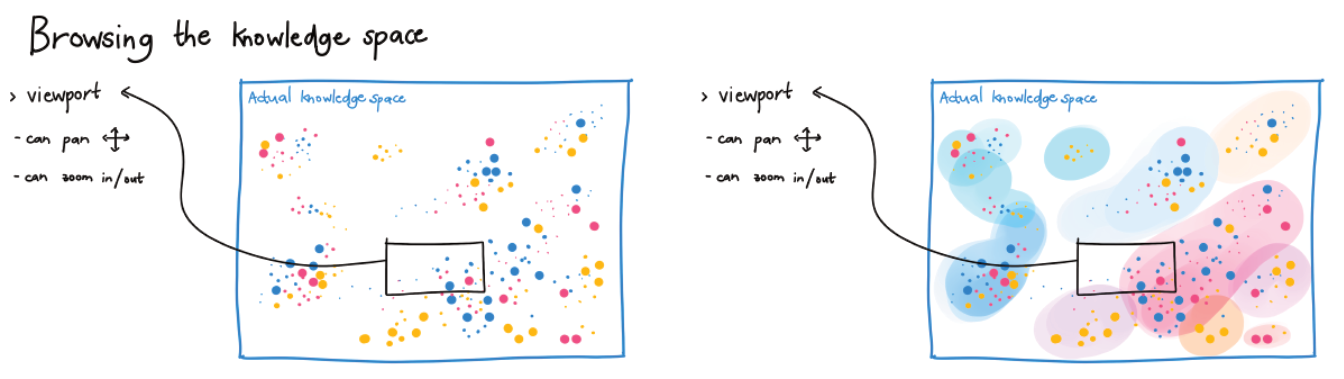
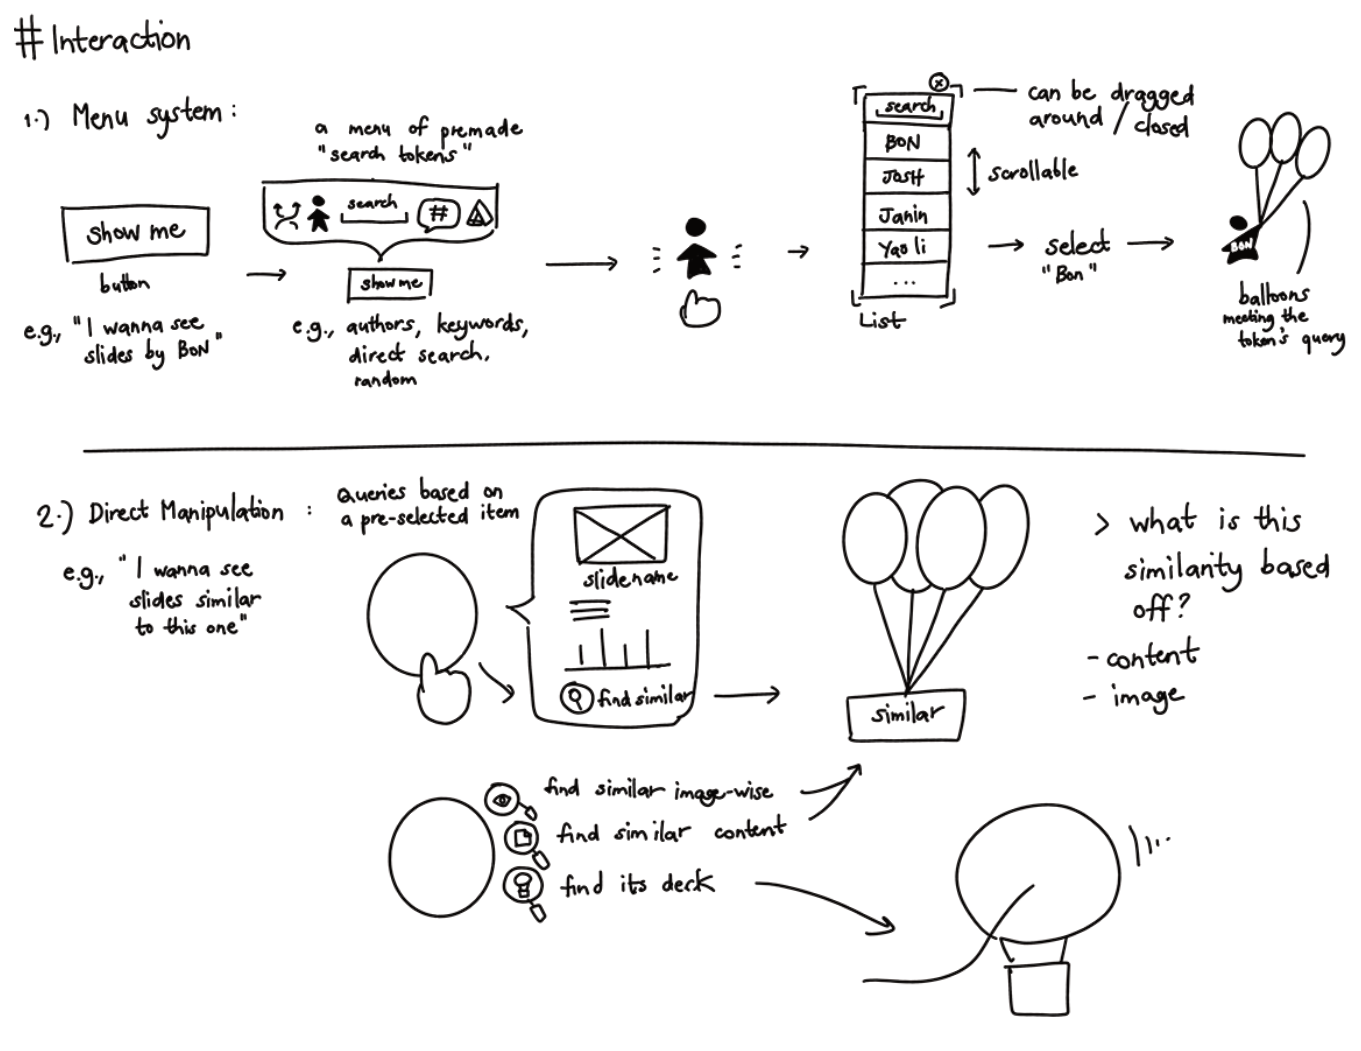
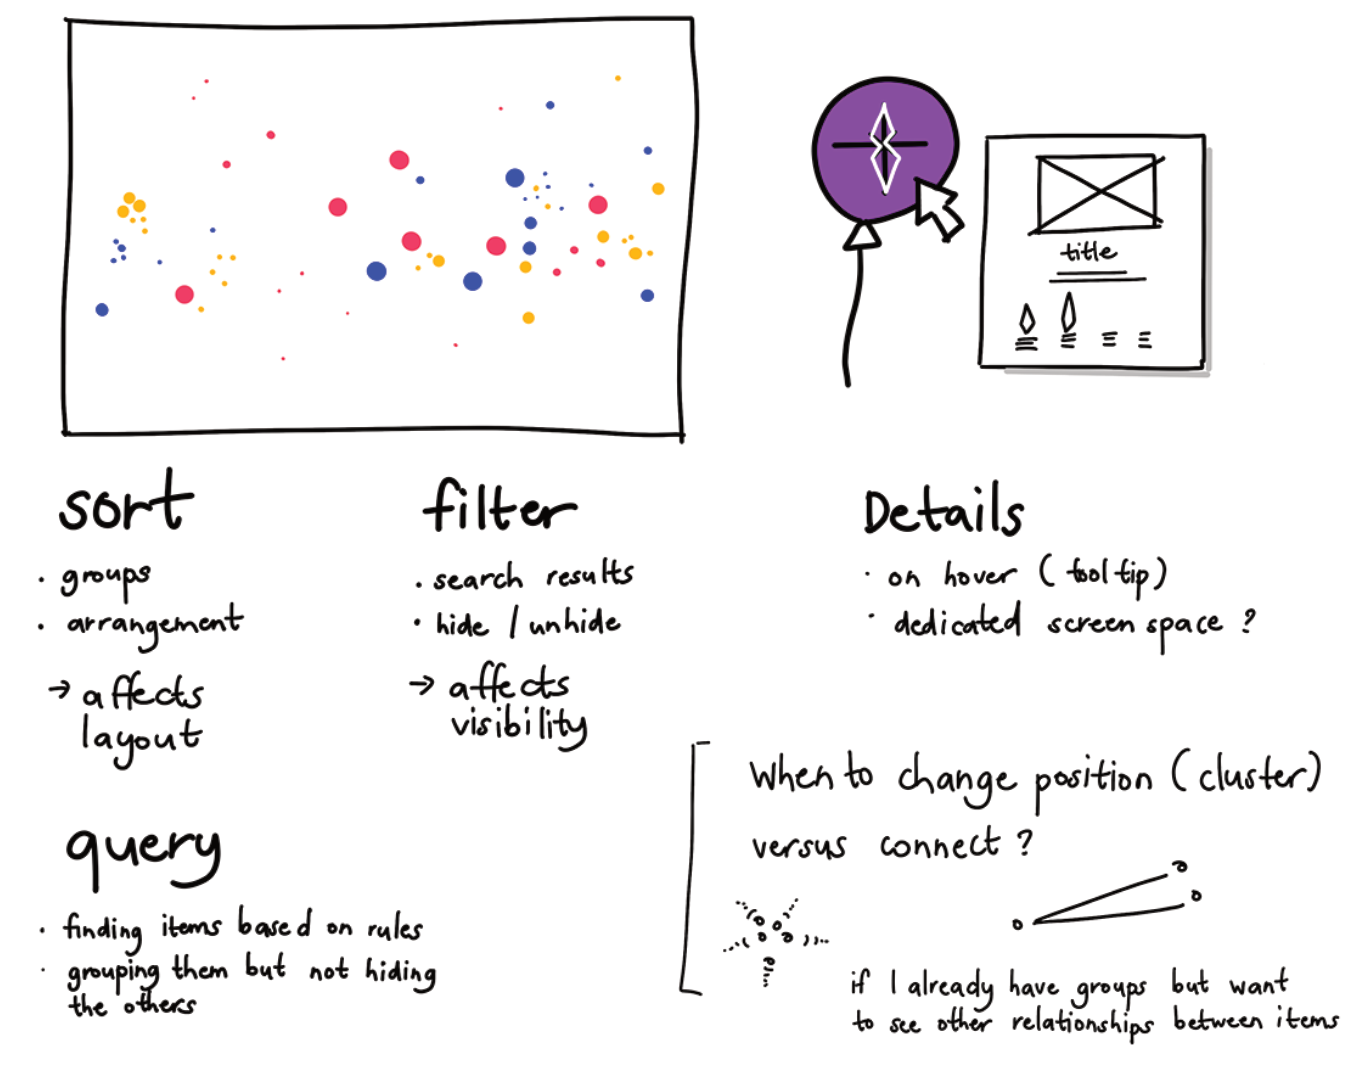
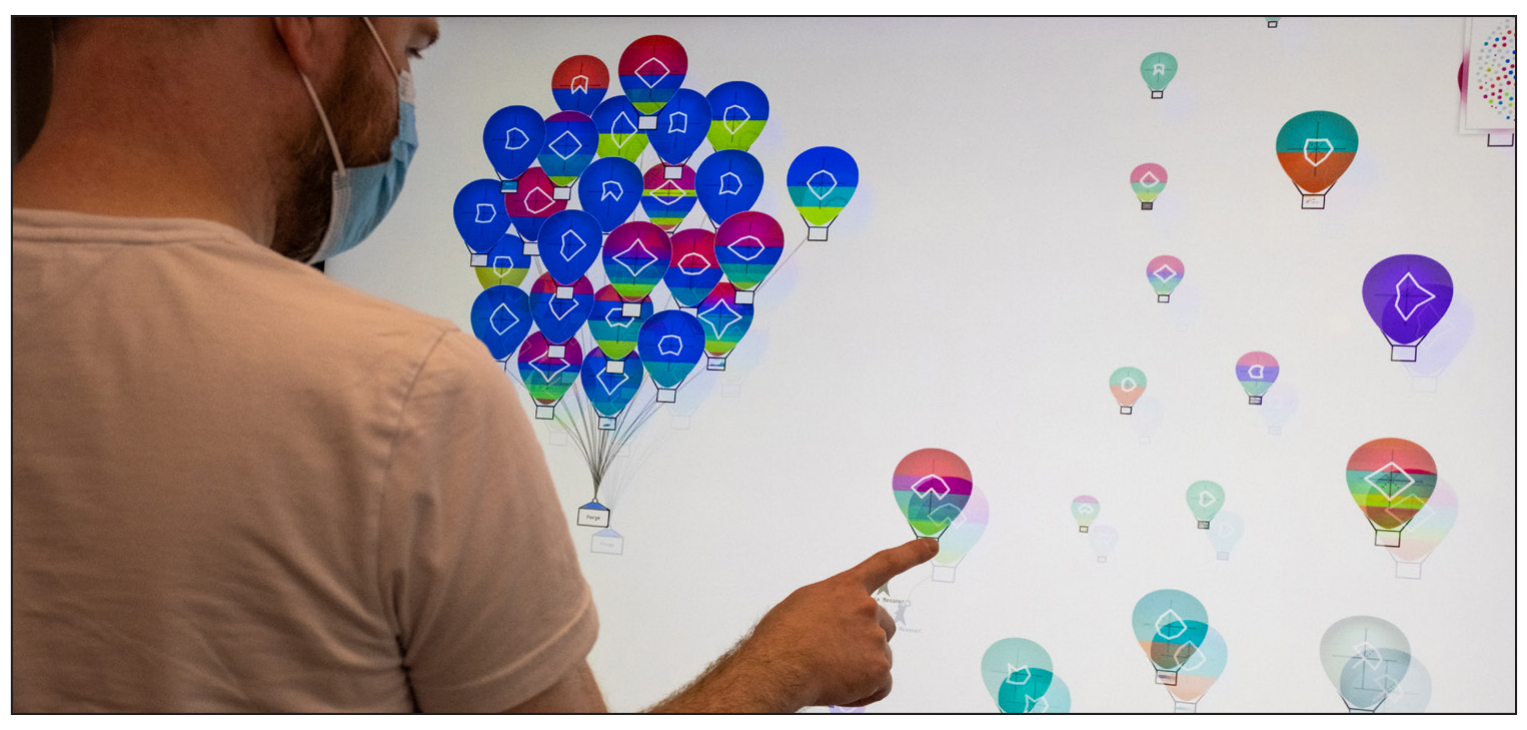
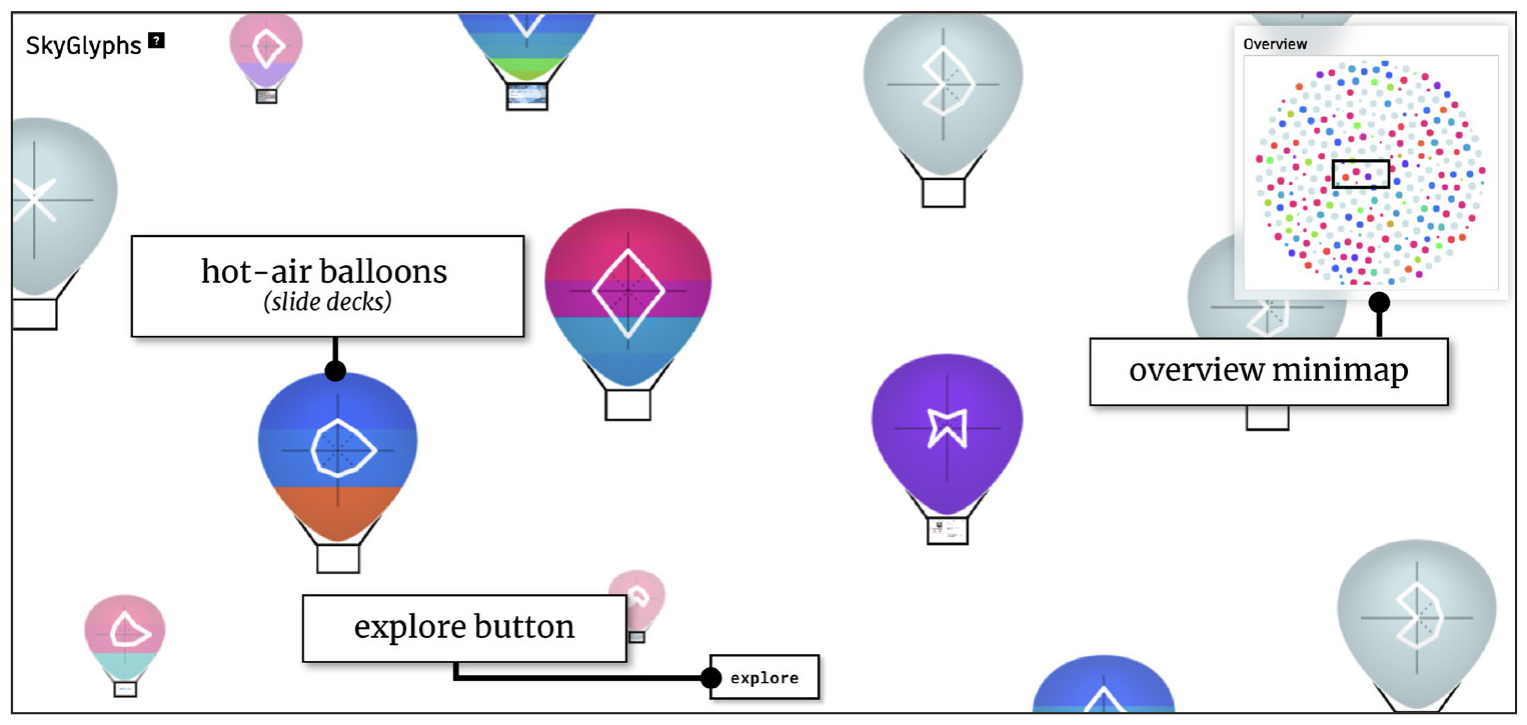
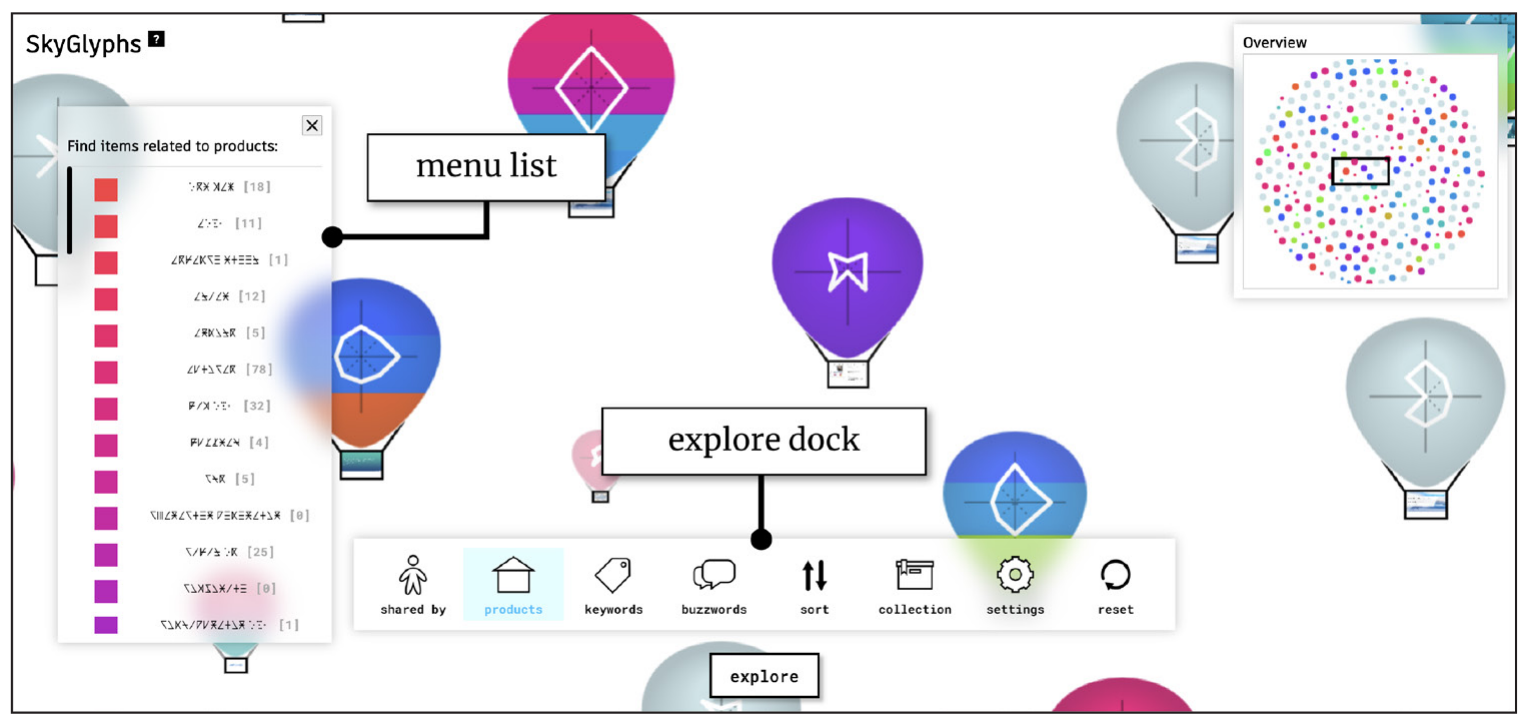
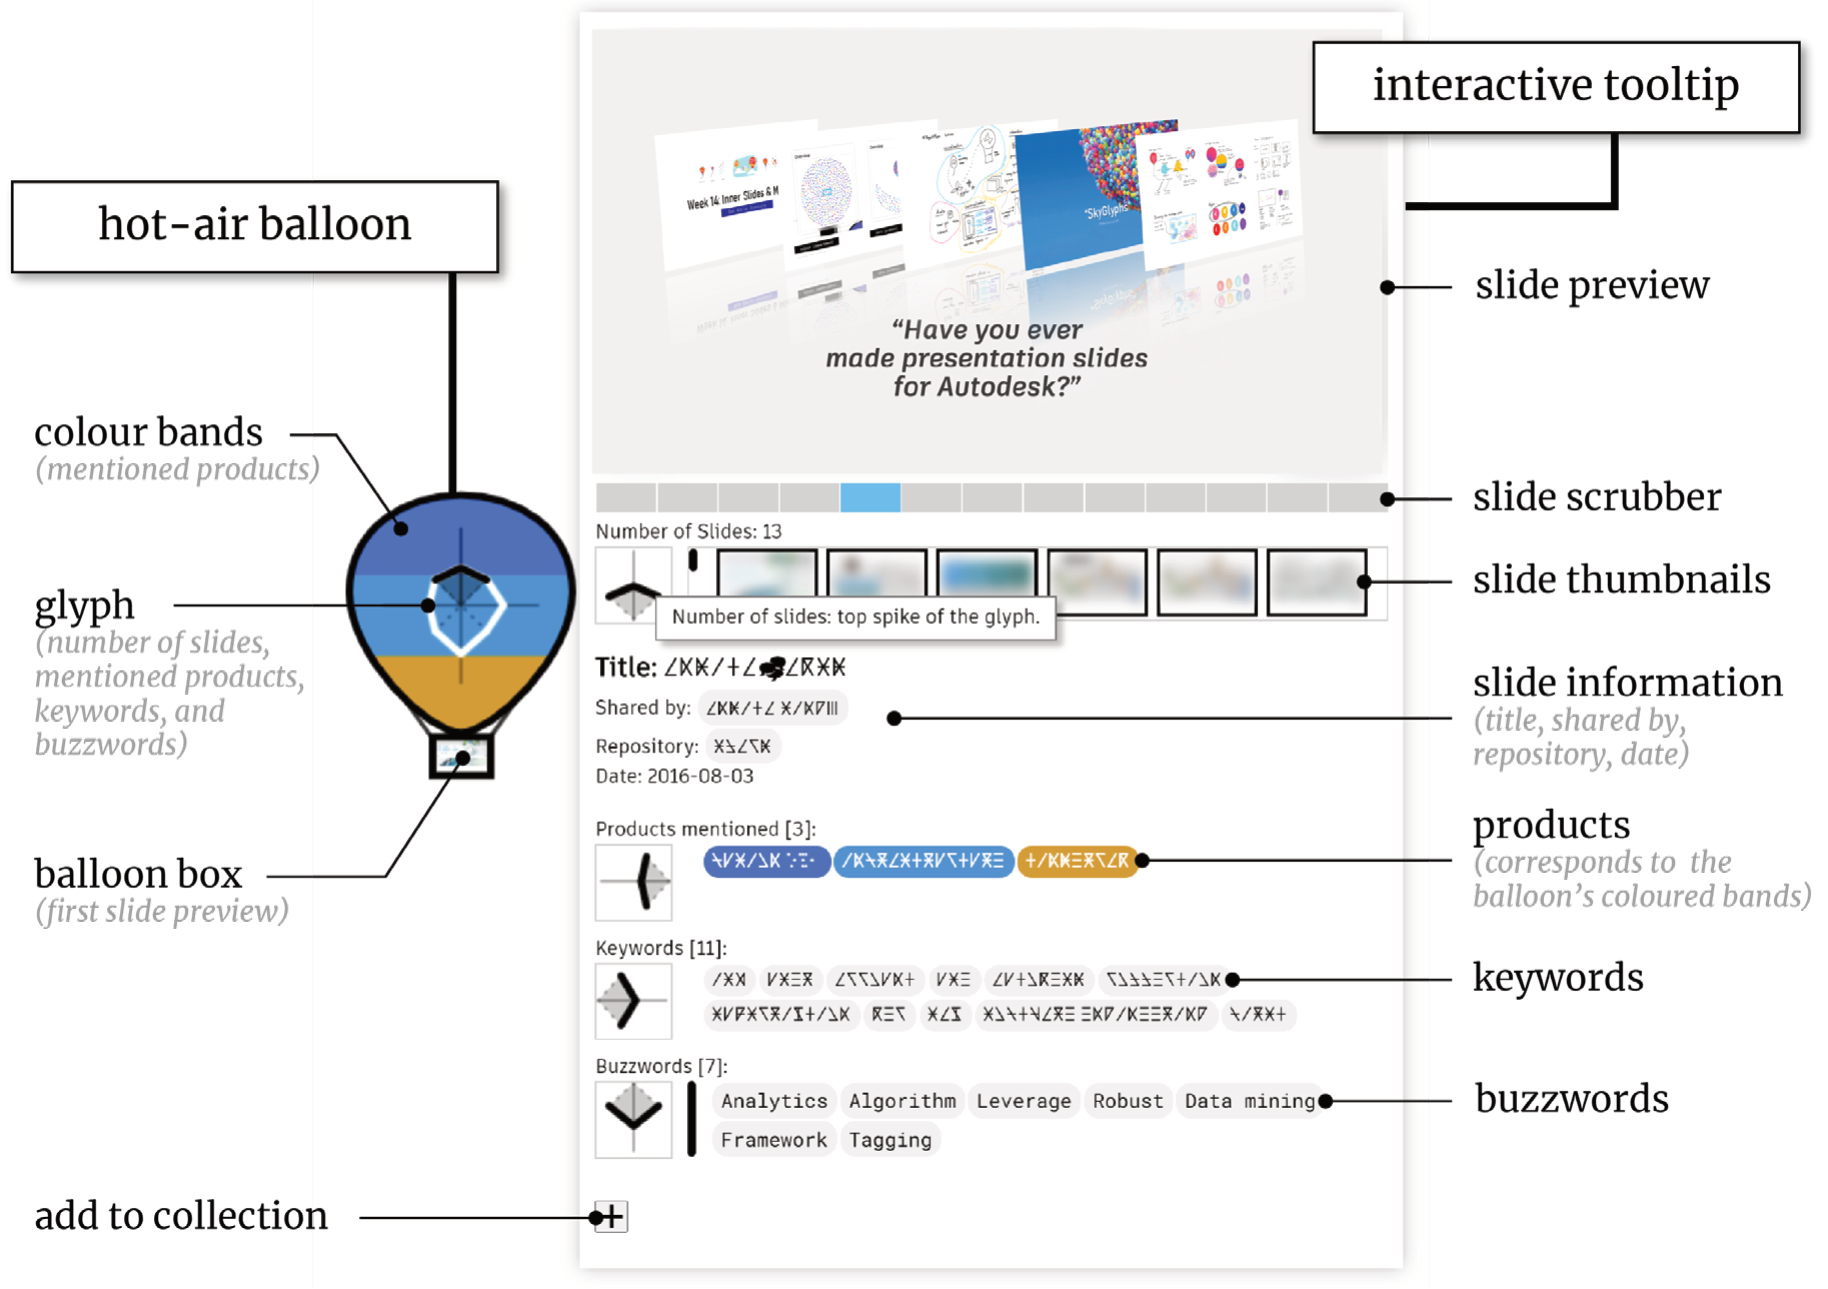
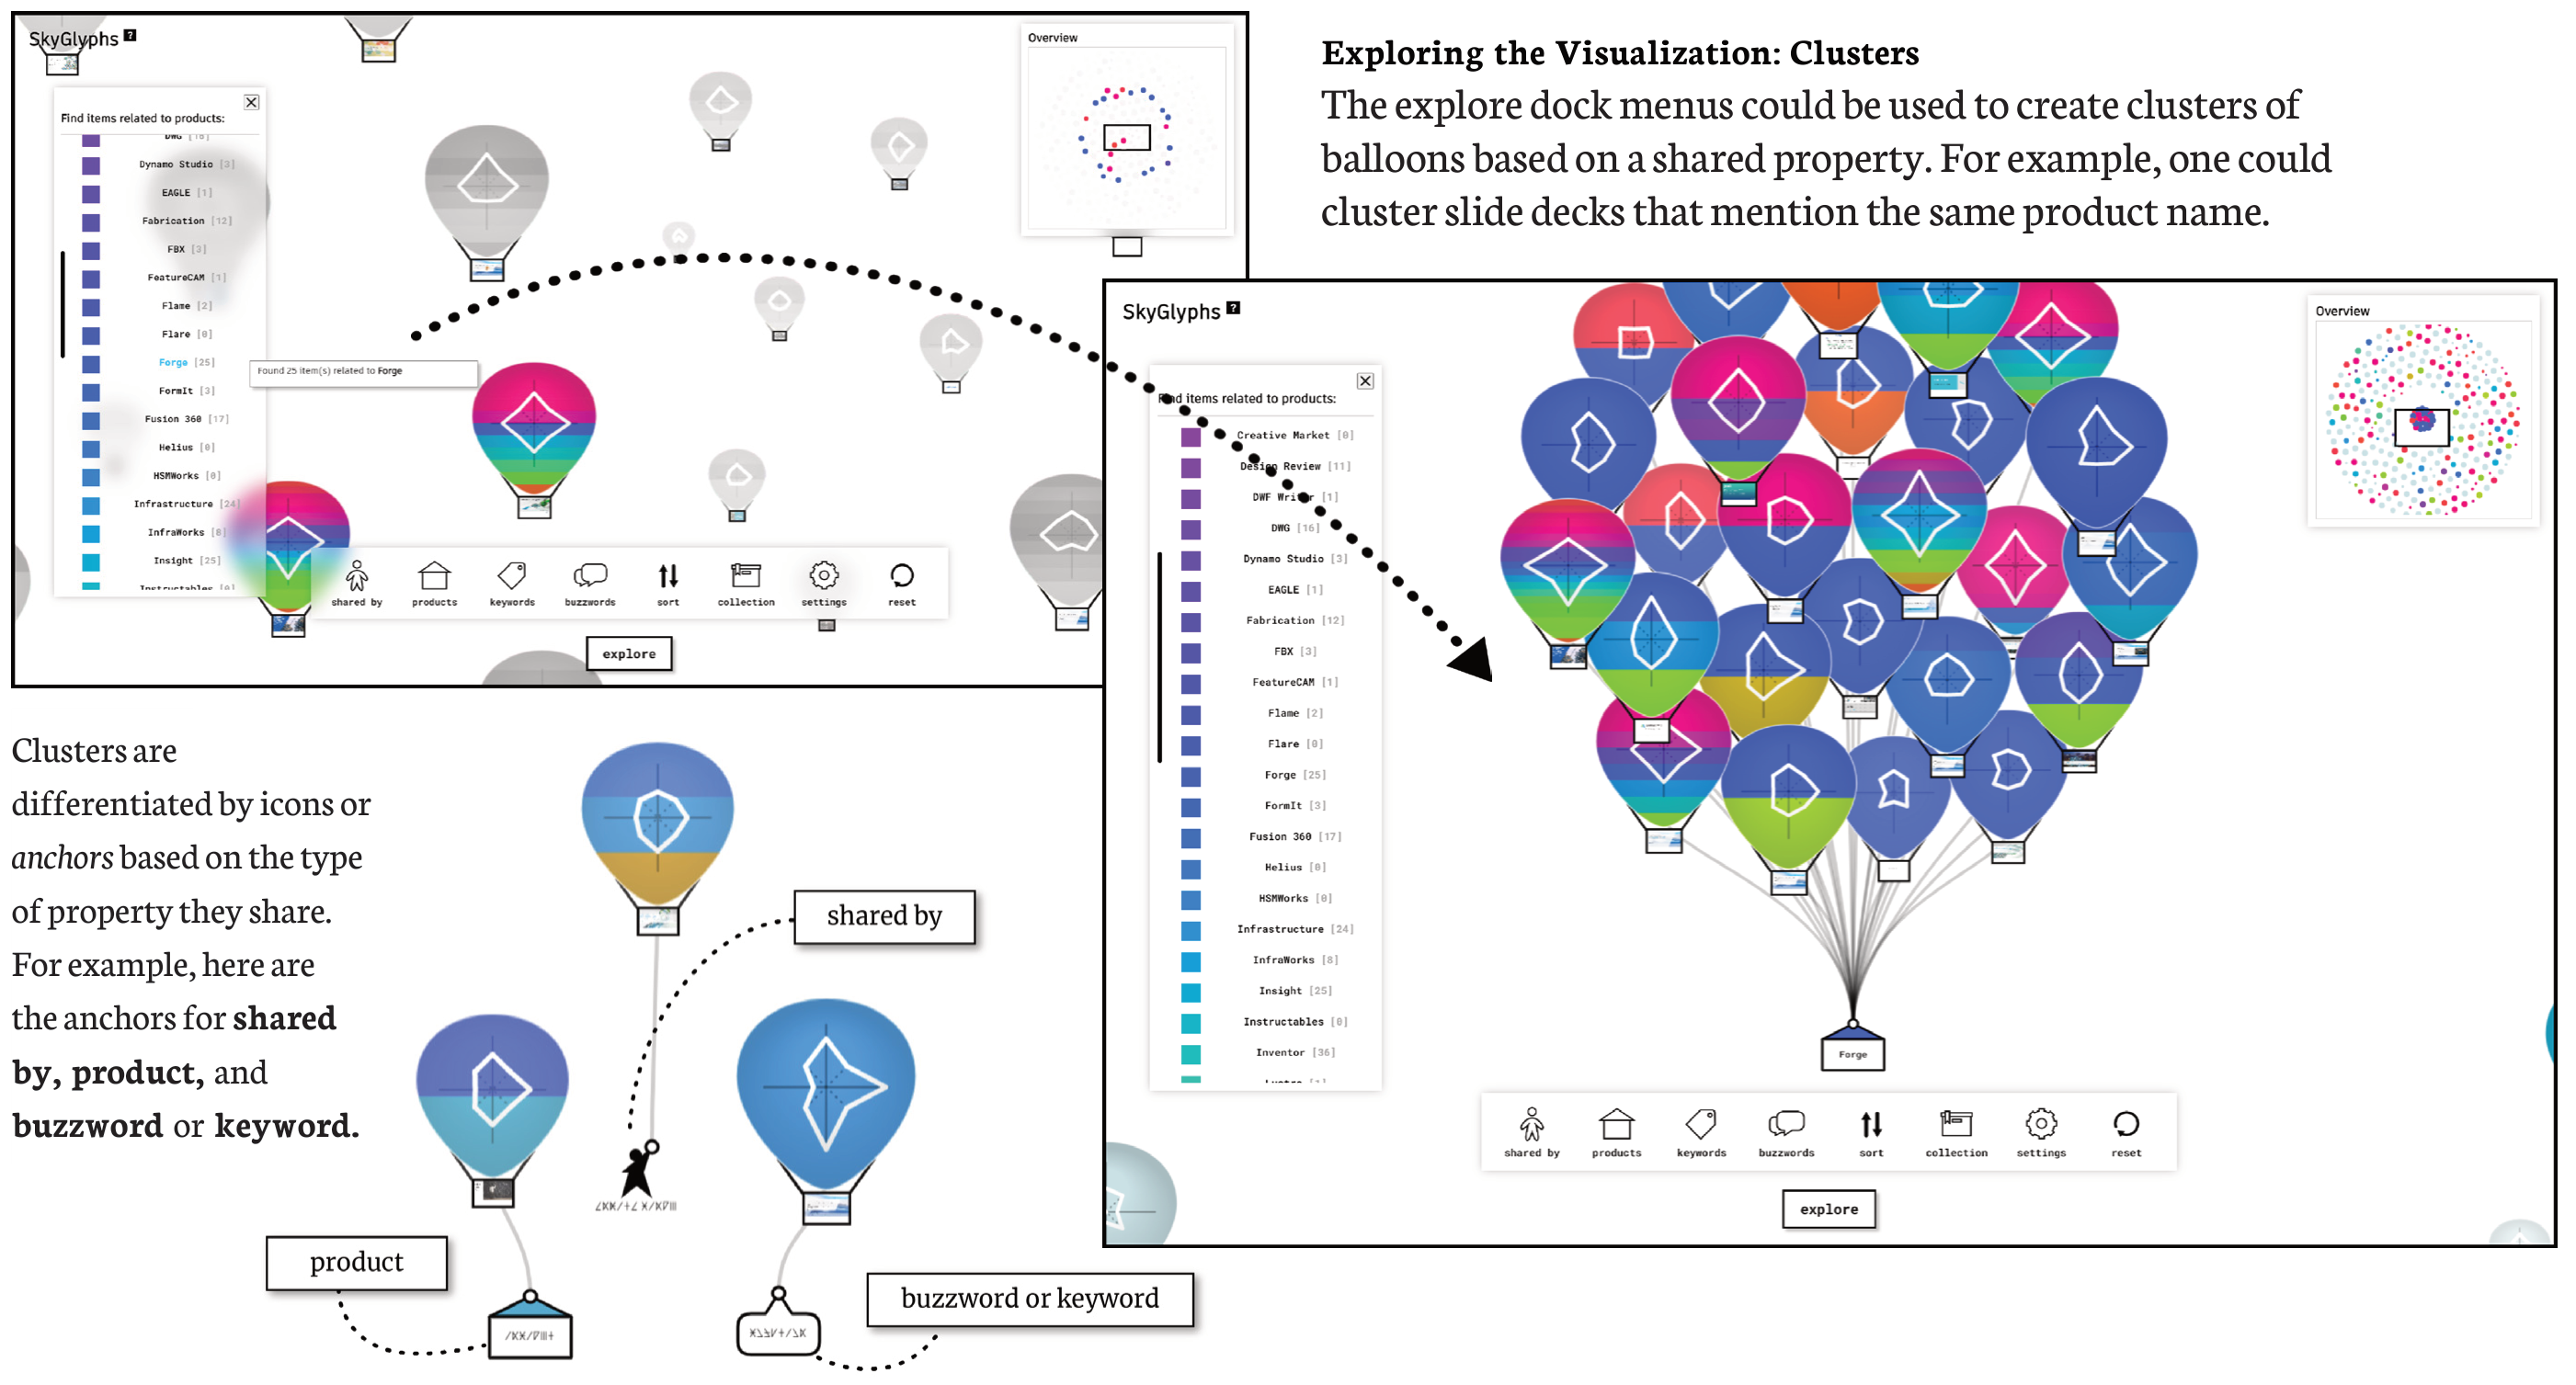
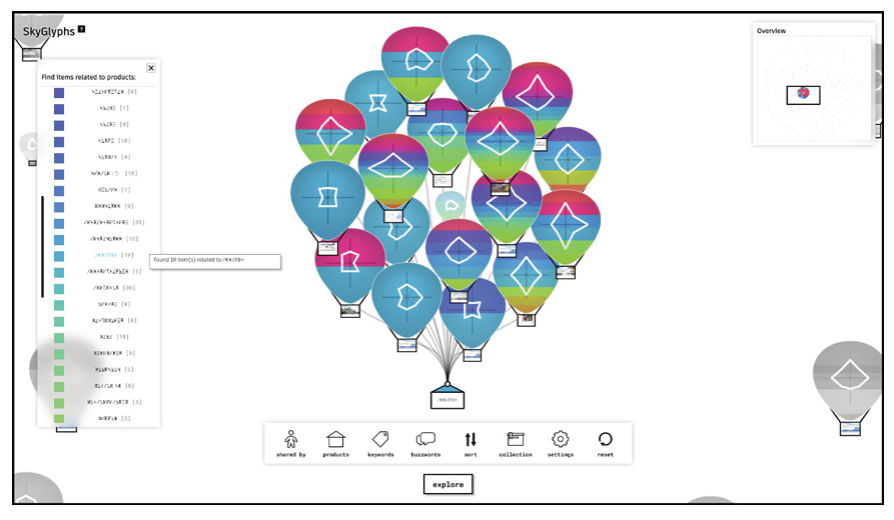
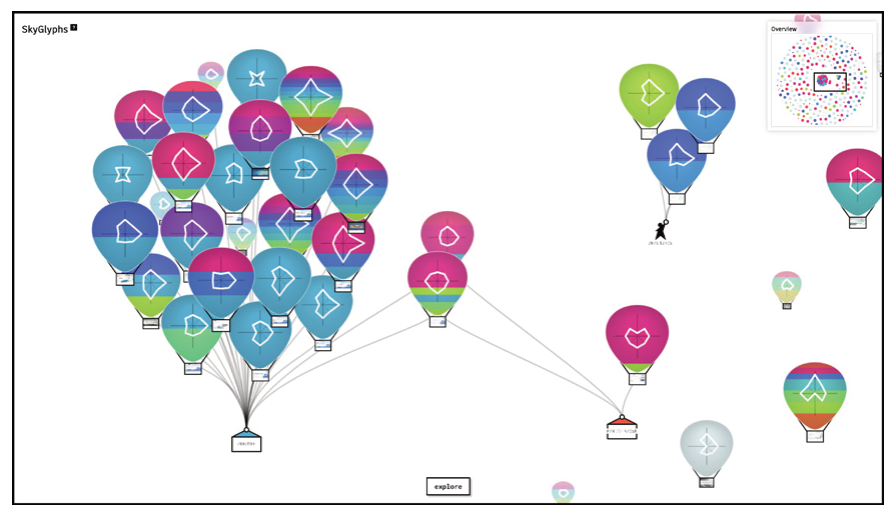
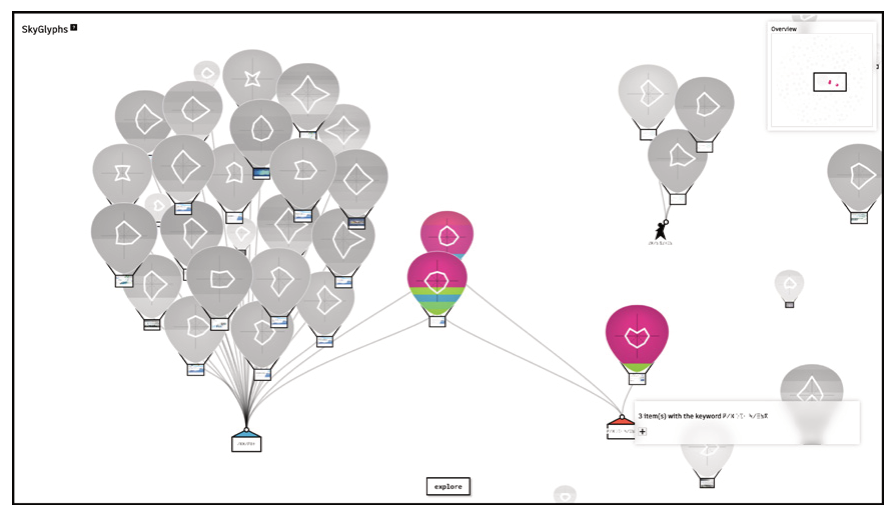
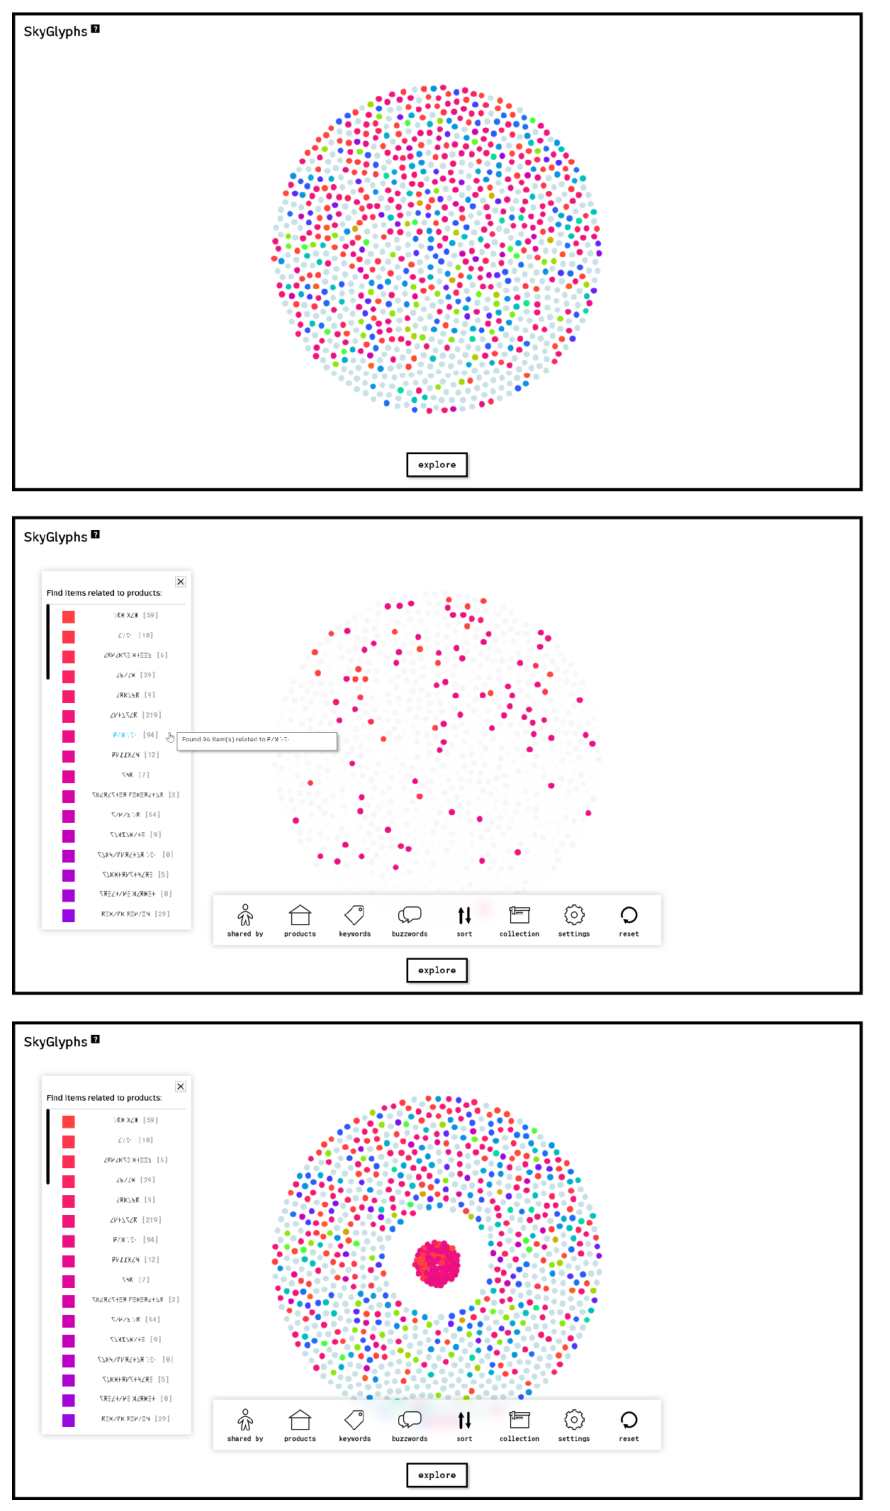
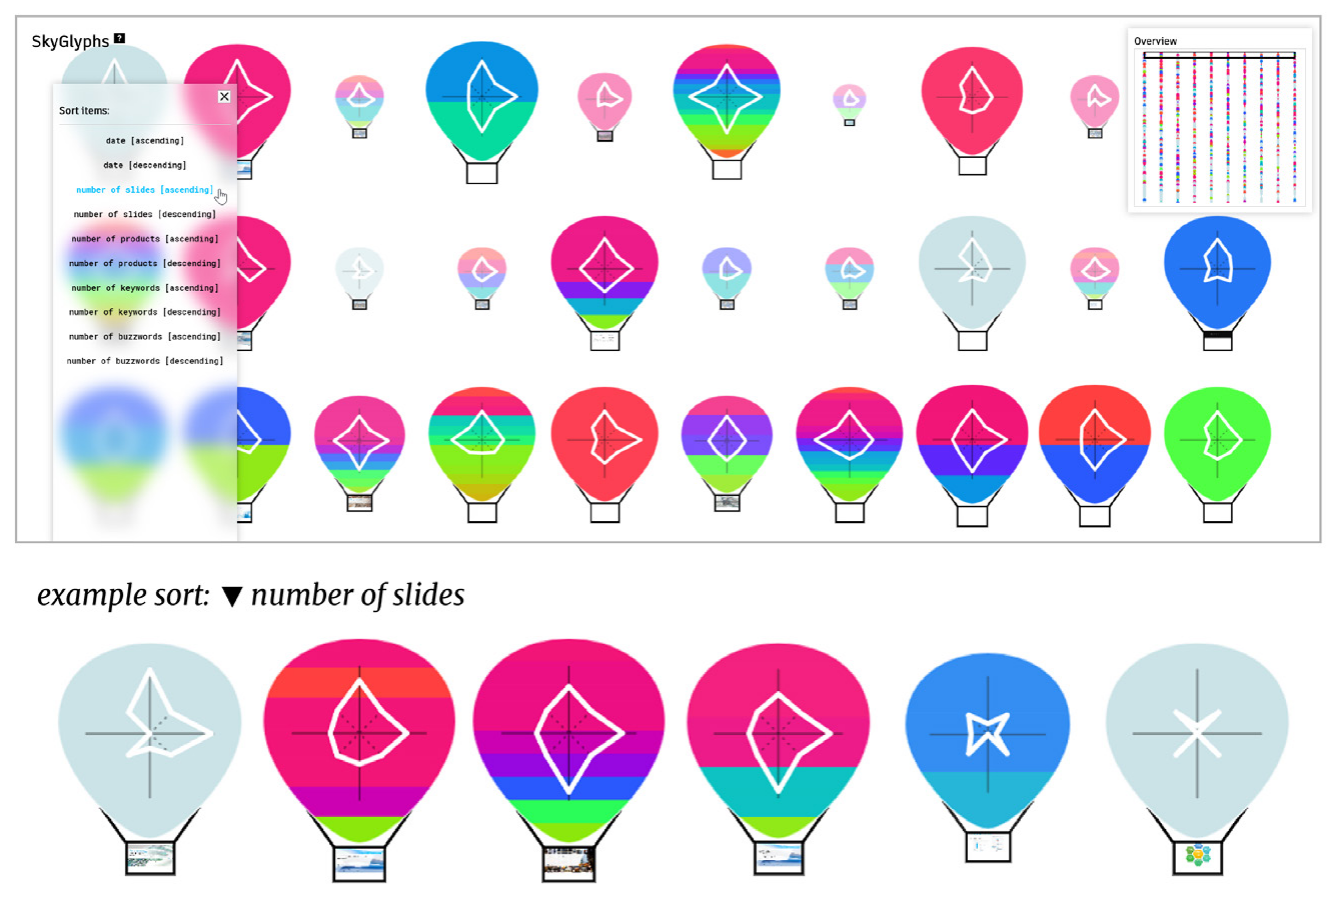
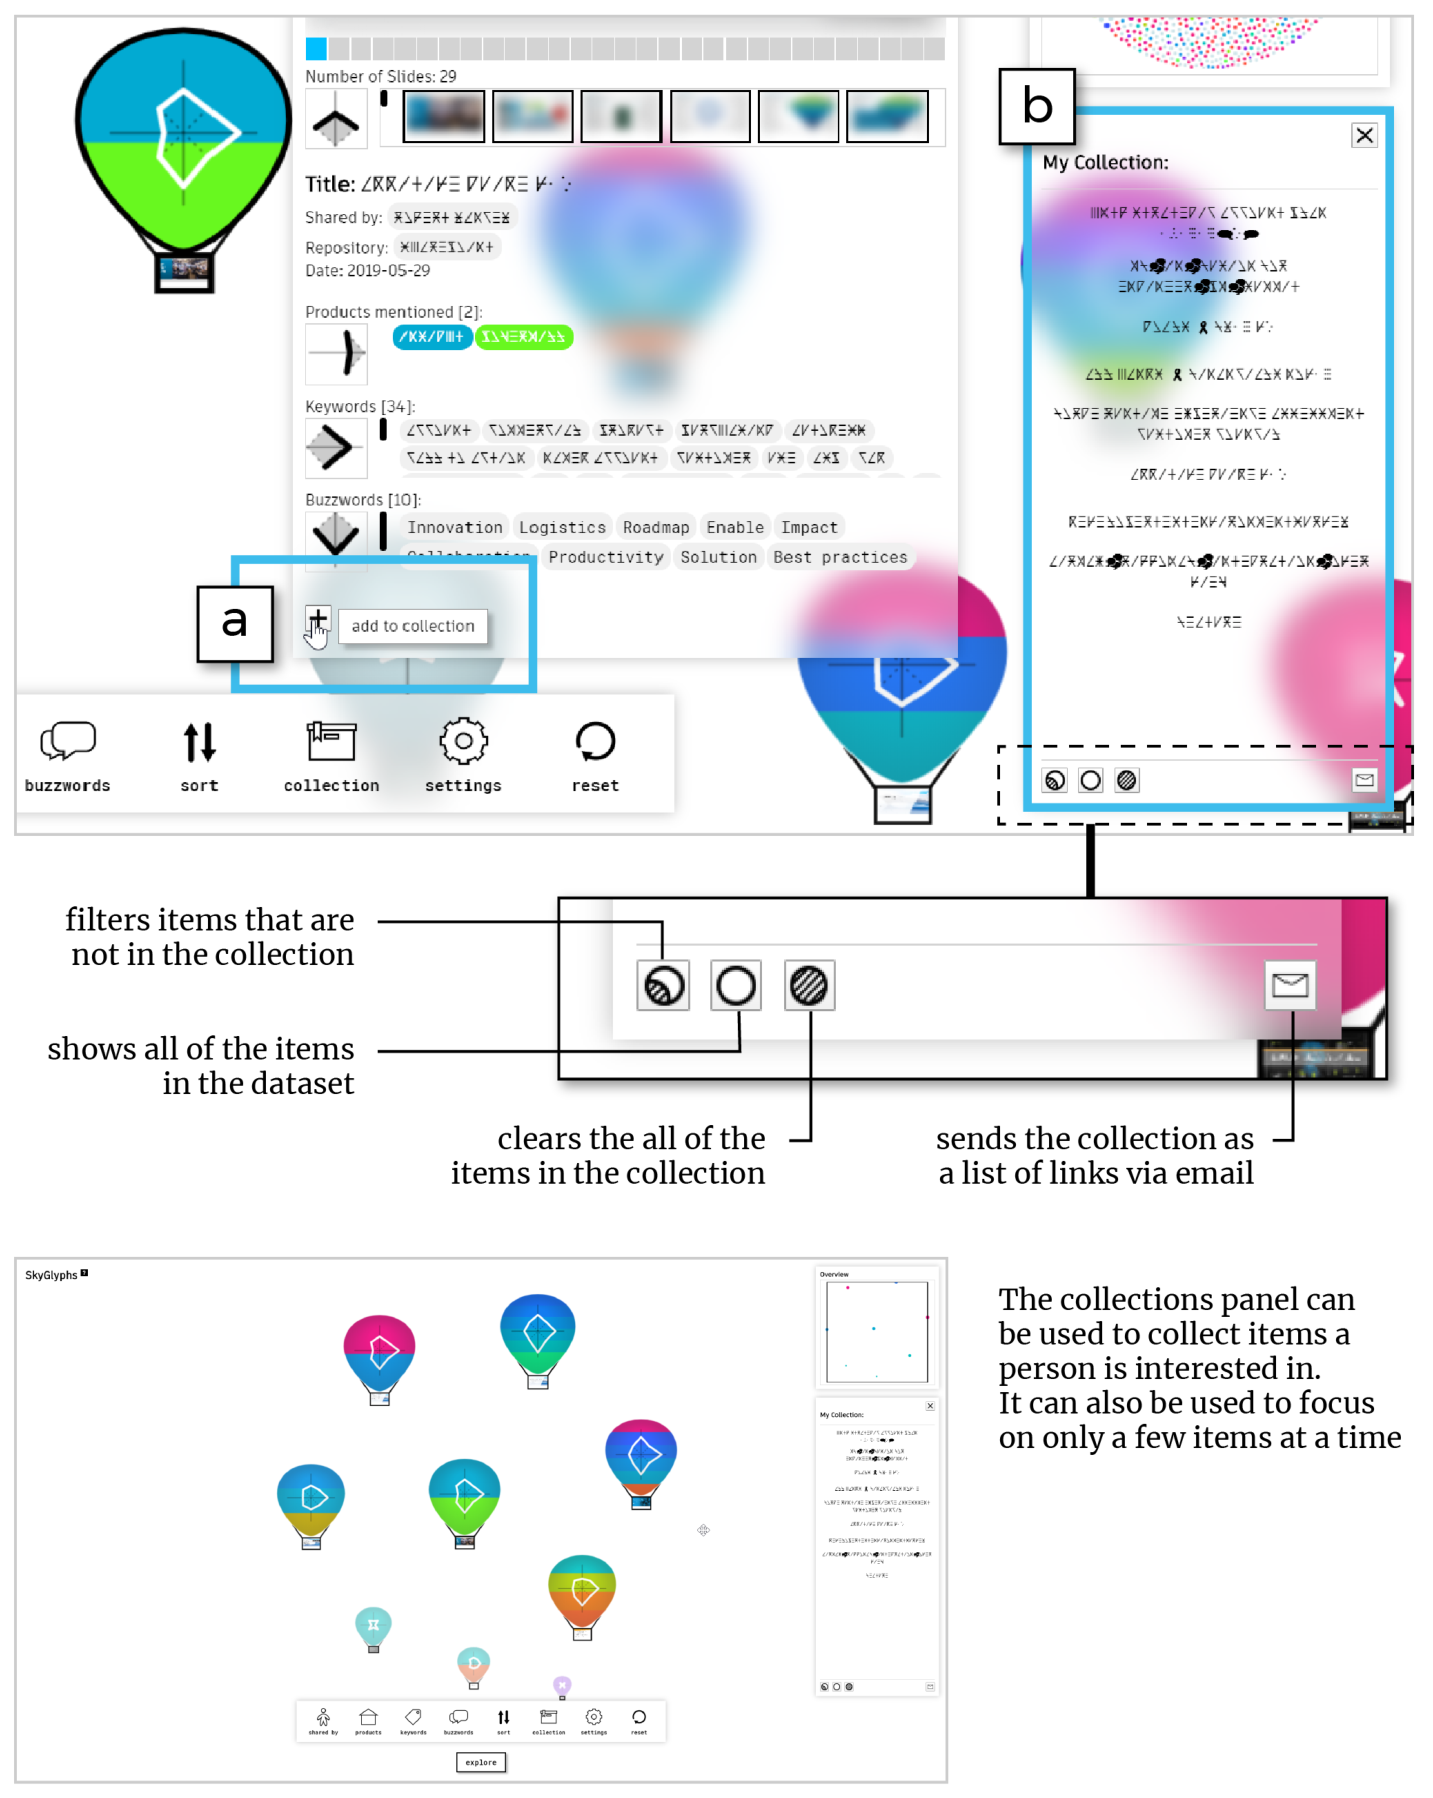
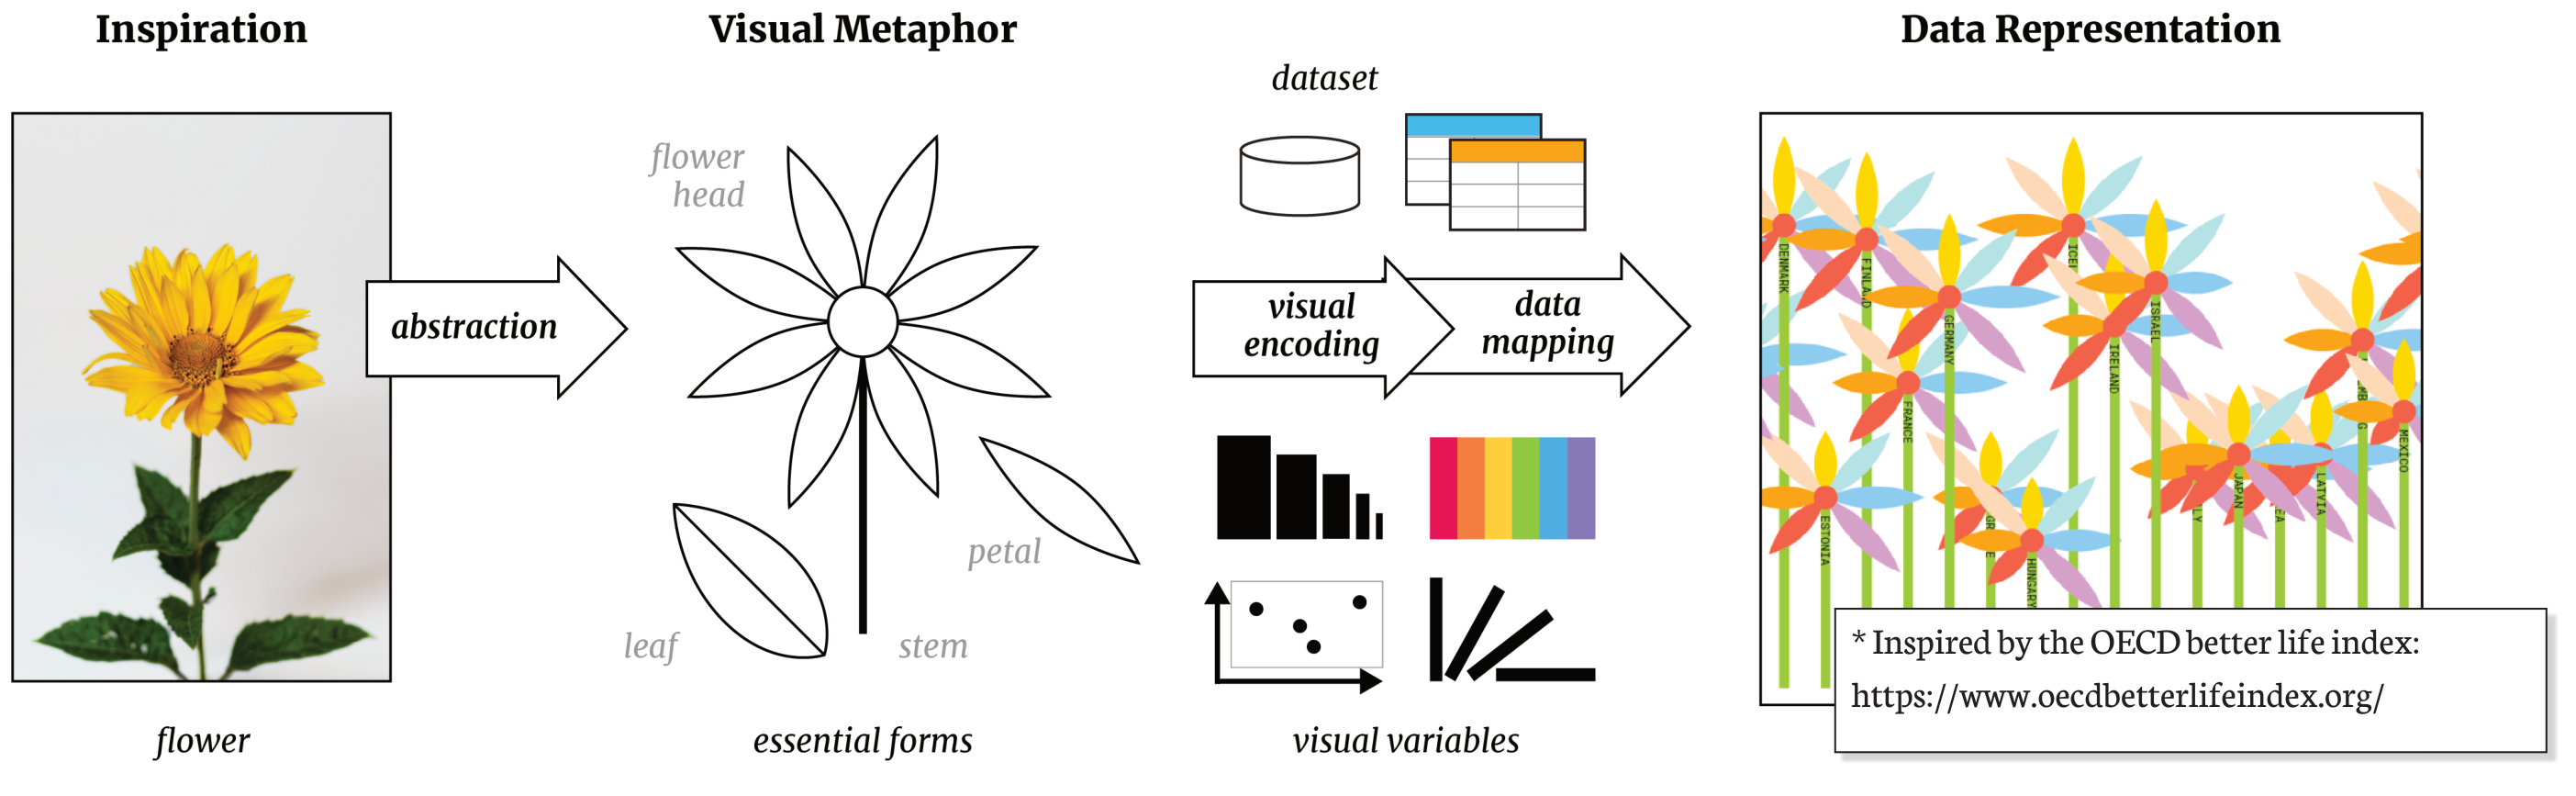
In creating SkyGlyphs, our goal was to develop a data visualization that could possibly capture people’s attention and spark their curiosity to explore a dataset. This work was inspired by a mingling of research including serendipitous interactions, visualizations for public displays, and personal visualizations. SkyGlyphs is a nonconventional whimsical visualization, depicting datapoints as animated balloons in space. We designed it to encourage non-experts to casually browse the contents of a repository through visual interactions like linking and grouping of datapoints. Our contributions include SkyGlyphs’ representation and our design reflection that reveals a perspective on how to design delightful visualizations.

Figures

A person walks by a large screen display showing SkyGlyphs, a data visualization that we designed to have a nonconventional data representation to captivate people’s attention and leverage their curiosity to explore a dataset.
Photo of a datavis designer’s sketchbooks in which they sketch their datavis designs before implementing them.
Figure 3
We explored different ways of how to abstract the balloon metaphor, ranging from highly abstracted to more realistic or figurative styles.
Wealso sketched other possible metaphors from inspirations like fish tanks, swarming insects, and combining familiar abstractions like bubble sets and stackgraphs.
Figure 6
Figure 7
Figure 8
Figure 9
Figure 10
Figure 11
Figure 12
Figure 13
Figure 14
Figure 15
Figure 16
Figure 17
Figure 18
The spiked glyph could be thought of as radial visualization (star plot) with four axes (shown in blue). The shorter axes (shown as dotted lines) act as anchors to create the spikes.
The anchored glyph design allows for interesting shapes to form compared to a typical four-axis star plot that could collapse to a single line or a dot.
Figure 21
A single balloon cluster based on a mentioned product.
Two clusters with shared balloons.
Hovering over a cluster’s anchor will highlight the balloons that belong to it.
Figure 25
Figure 26
Figure 27
Figure 28
Both of these illustrations use a flower visual metaphor, however both have very different look-and-feel (theme). These characteristics can be intentionally used when designing nonconventional datavis that appeal to different emotions.
Figure 30

BibTeX

@inproceedings{aseniero2022skyglyphs,
  title = {Skyglyphs: Reflections on the design of a delightful visualization},
  author = {Aseniero, Bon Adriel and Fitzmaurice, George and Carpendale, Sheelagh and Matejka, Justin},
  booktitle = {2022 IEEE VIS Arts Program (VISAP)},
  pages = {105--120},
  year = {2022},
  organization = {IEEE},
}