How Tall is that Bar Chart? Virtual Reality, Distance Compression and Visualizations
Abstract
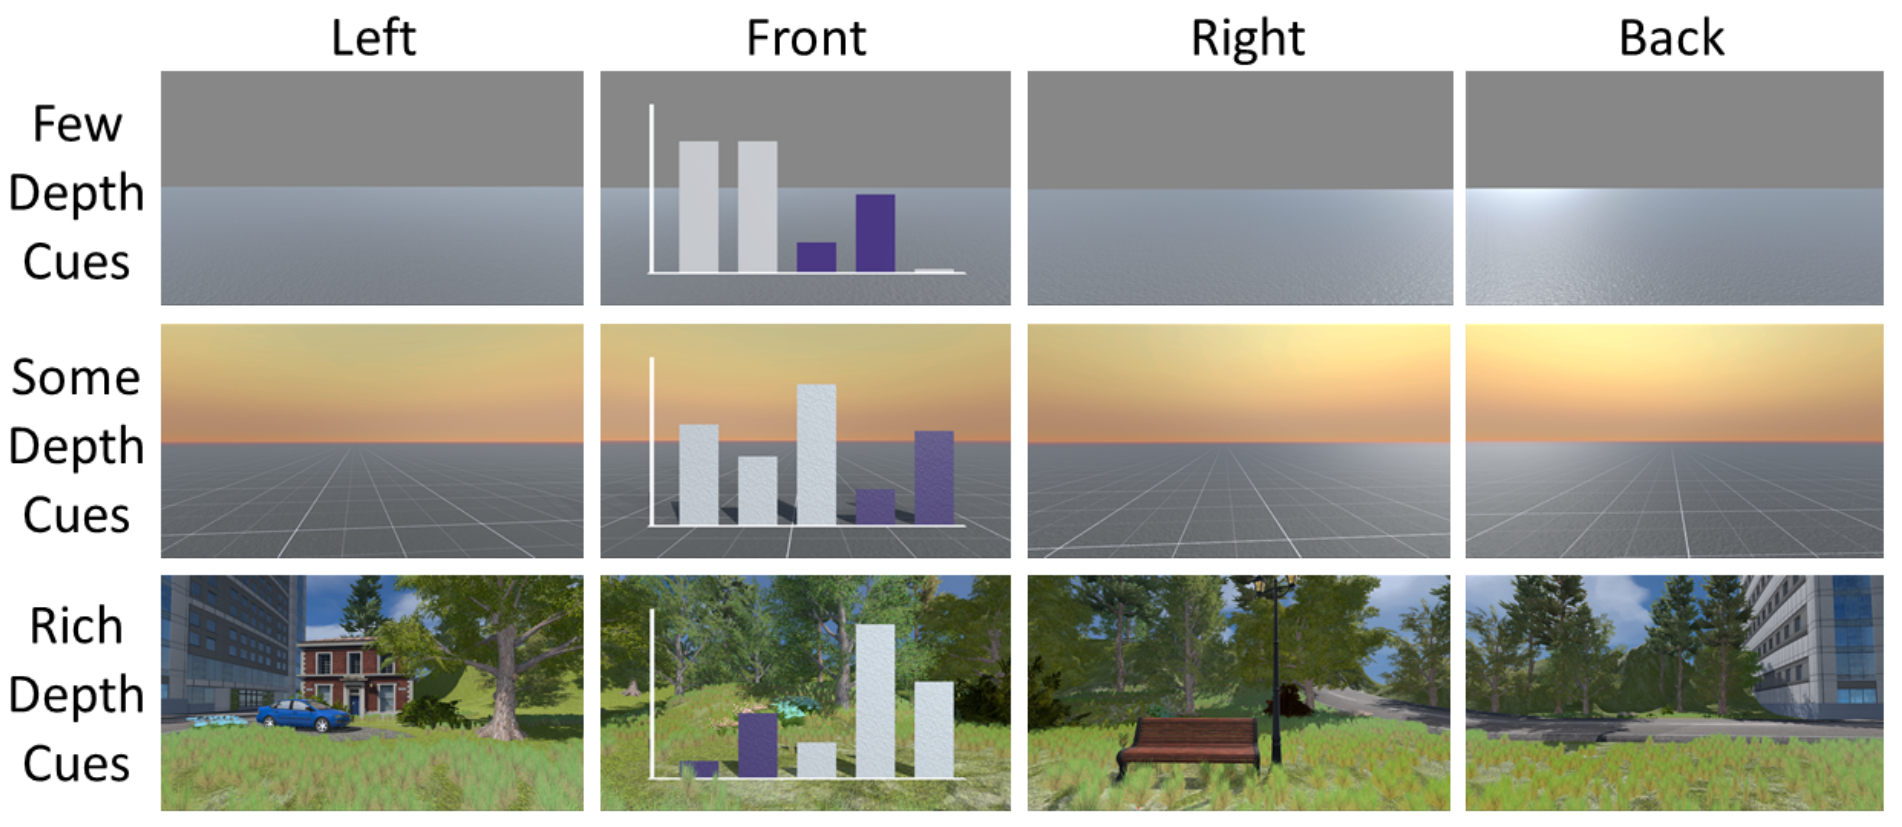
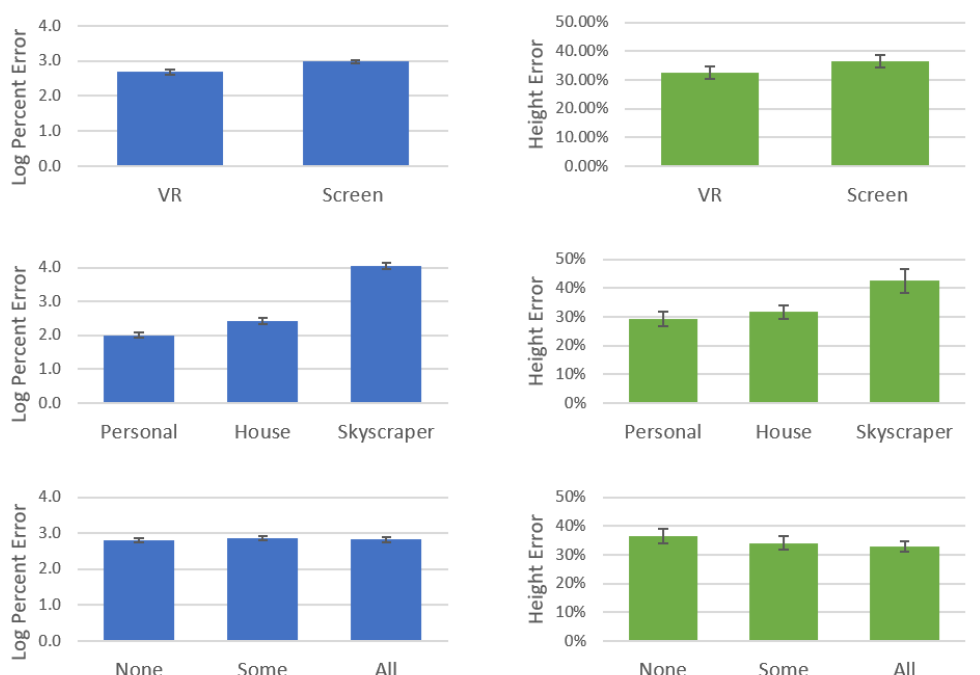
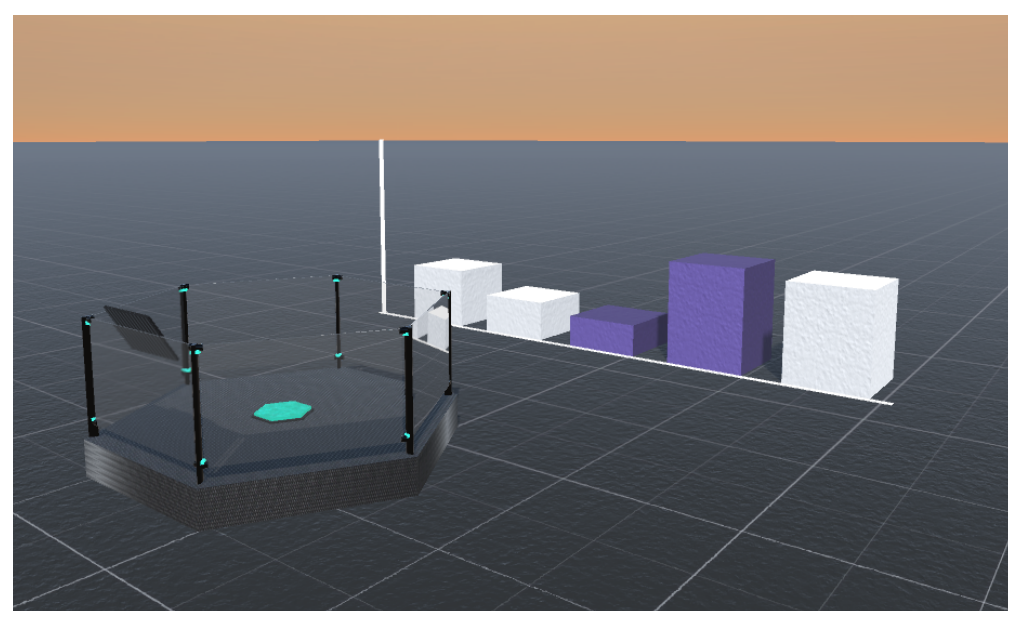
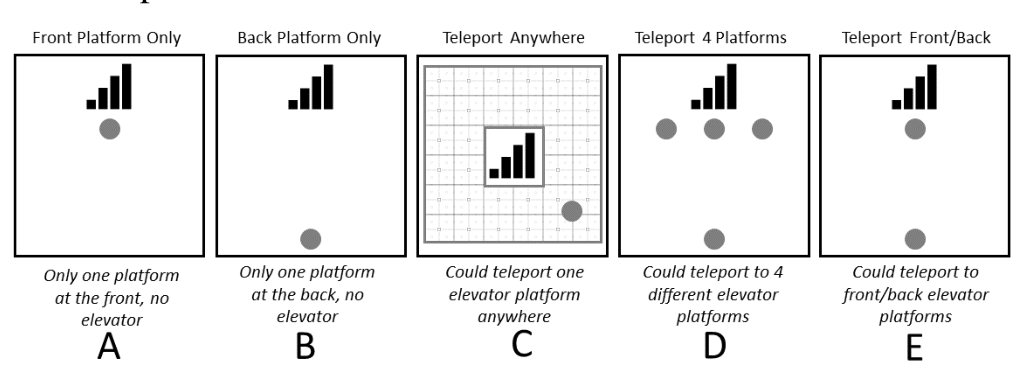
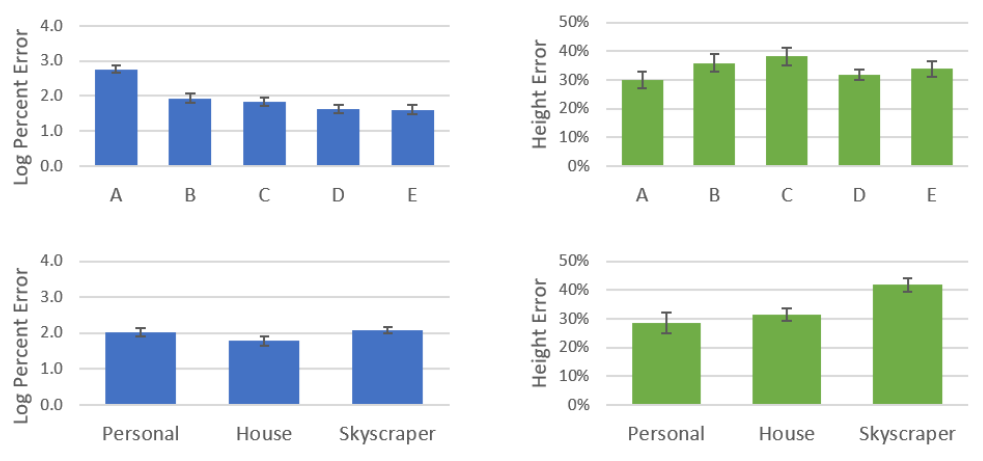
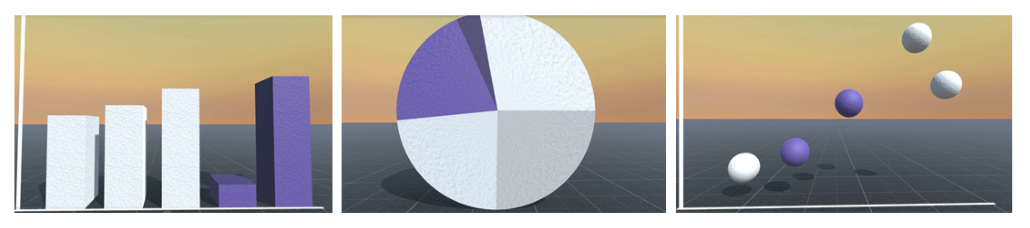
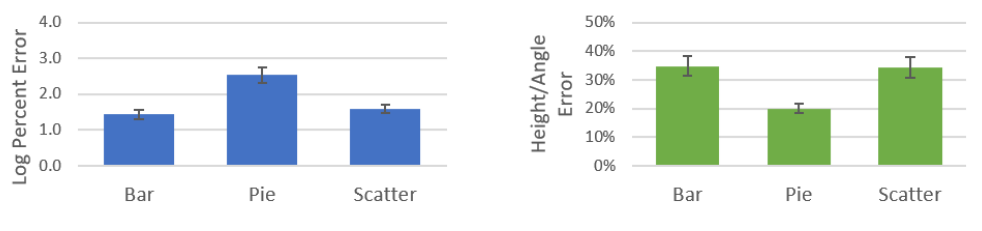
As VR technology becomes more available, VR applications will be increasingly used to present information visualizations. While data visualization in VR is an interesting topic, there remain questions about how effective or accurate such visualization can be. One known phenomenon with VR environments is that people tend to unconsciously compress or underestimate distances. However, it is unknown if or how this effect will alter the perception of data visualizations in VR. To this end, we replicate portions of Cleveland and McGill's foundational perceptual visualization studies, in VR. Through a series of three studies we find that distance compression does negatively affect estimations of actual lengths (heights of bars), but does not appear to impact relative comparisons. Additionally, by replicating the position-angle experiments, we find that (as with traditional 2D visualizations) people are better at relative length evaluations than relative angles. Finally, by looking at these open questions, we develop a series of best practices for performing data visualization in a VR environment.
Figures
BibTeX
@inproceedings{Watson:2021:10.20380/GI2021.29,
 author = {Watson, Diane and Fitzmaurice, George and Matejka, Justin},
 title = {How Tall is that Bar Chart? Virtual Reality, Distance Compression and Visualizations},
 booktitle = {Proceedings of Graphics Interface 2021},
 series = {GI 2021},
 year = {2021},
 issn = {0713-5424},
 isbn = {978-0-9947868-6-9},
 location = {Virtual Event},
 pages = {256 -- 264},
 numpages = {9},
 doi = {10.20380/GI2021.29},
 publisher = {Canadian Information Processing Society},
}