k
j

![]()
Patina: Dynamic Heatmaps for Visualizing Application Usage
Abstract
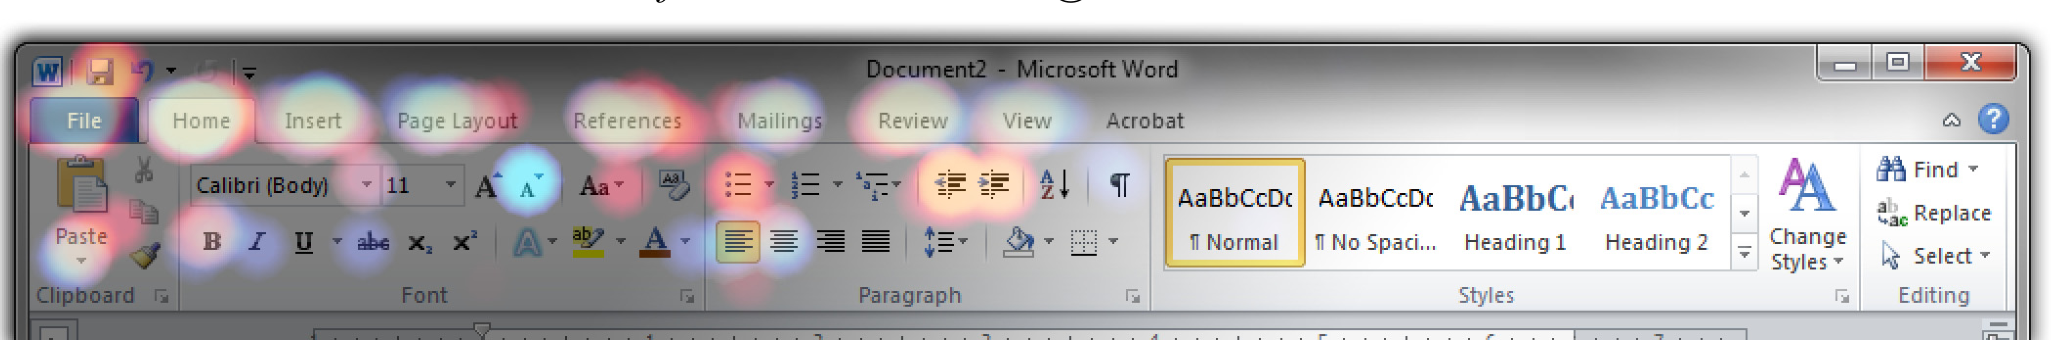
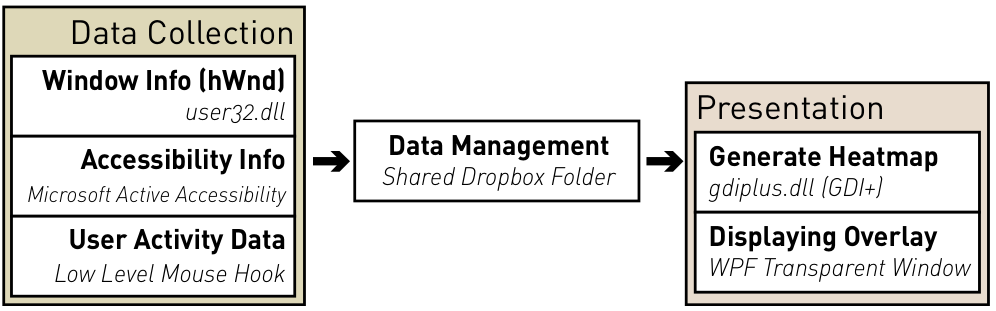
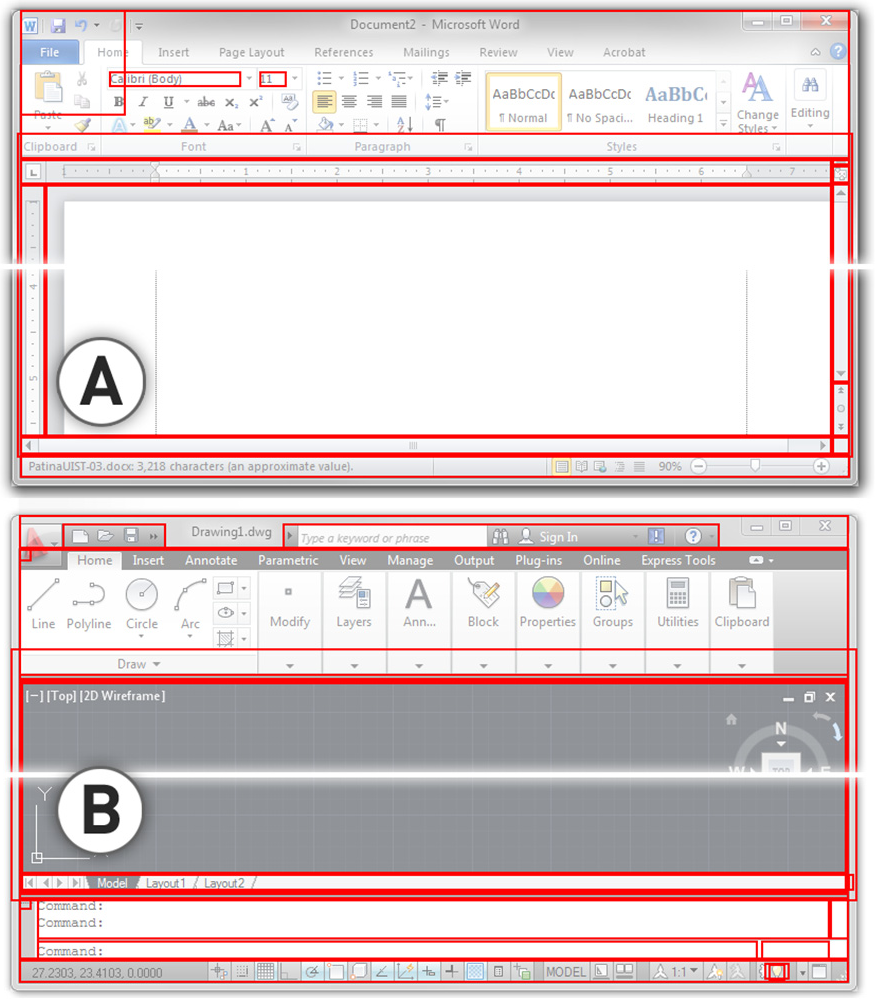
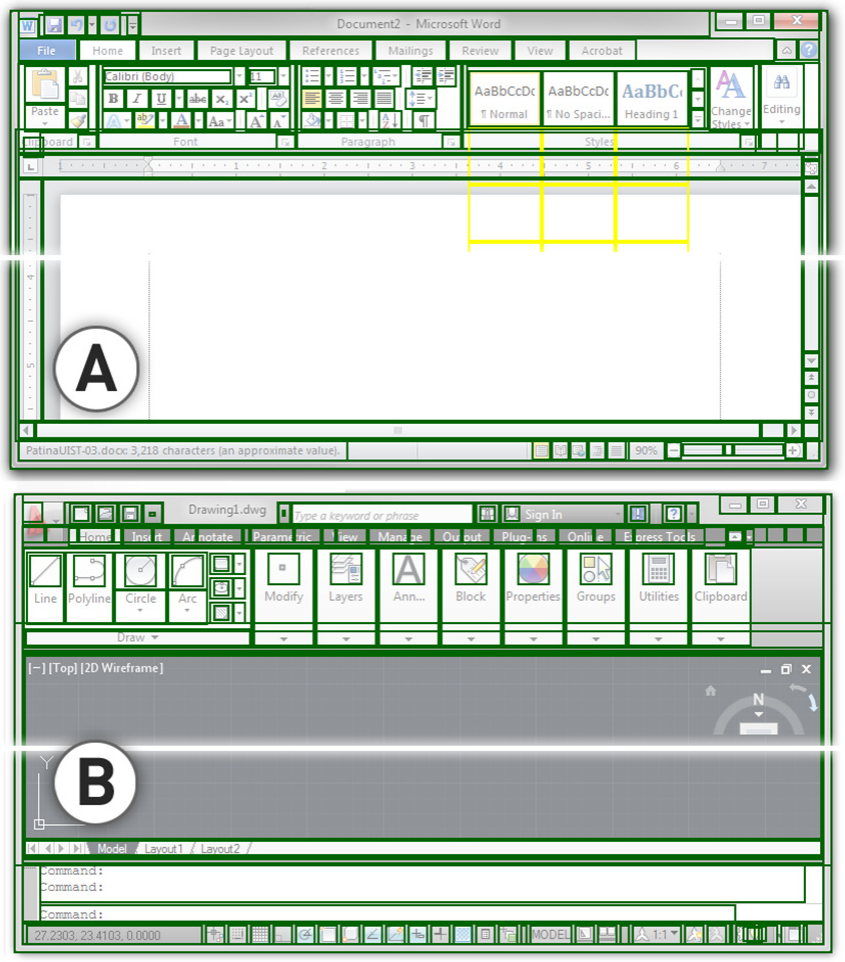
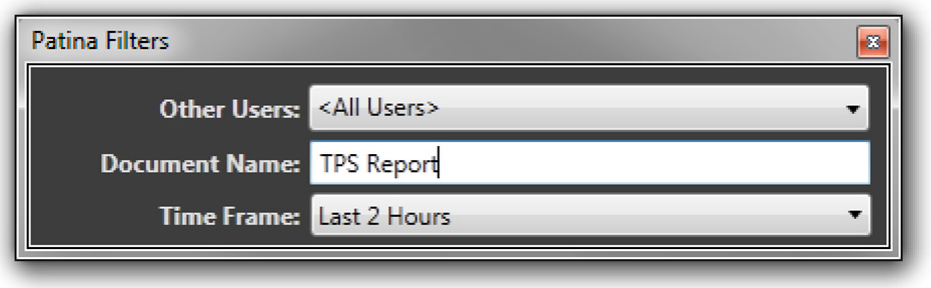
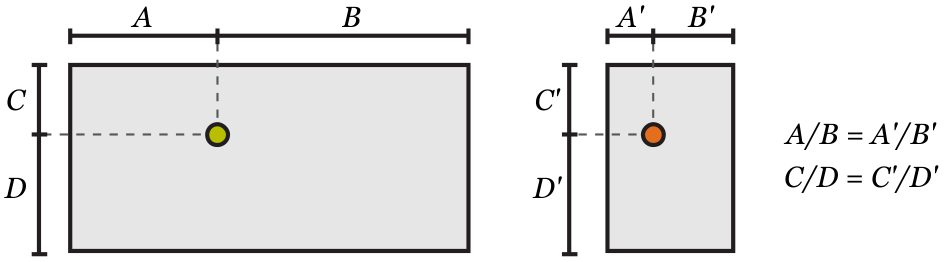
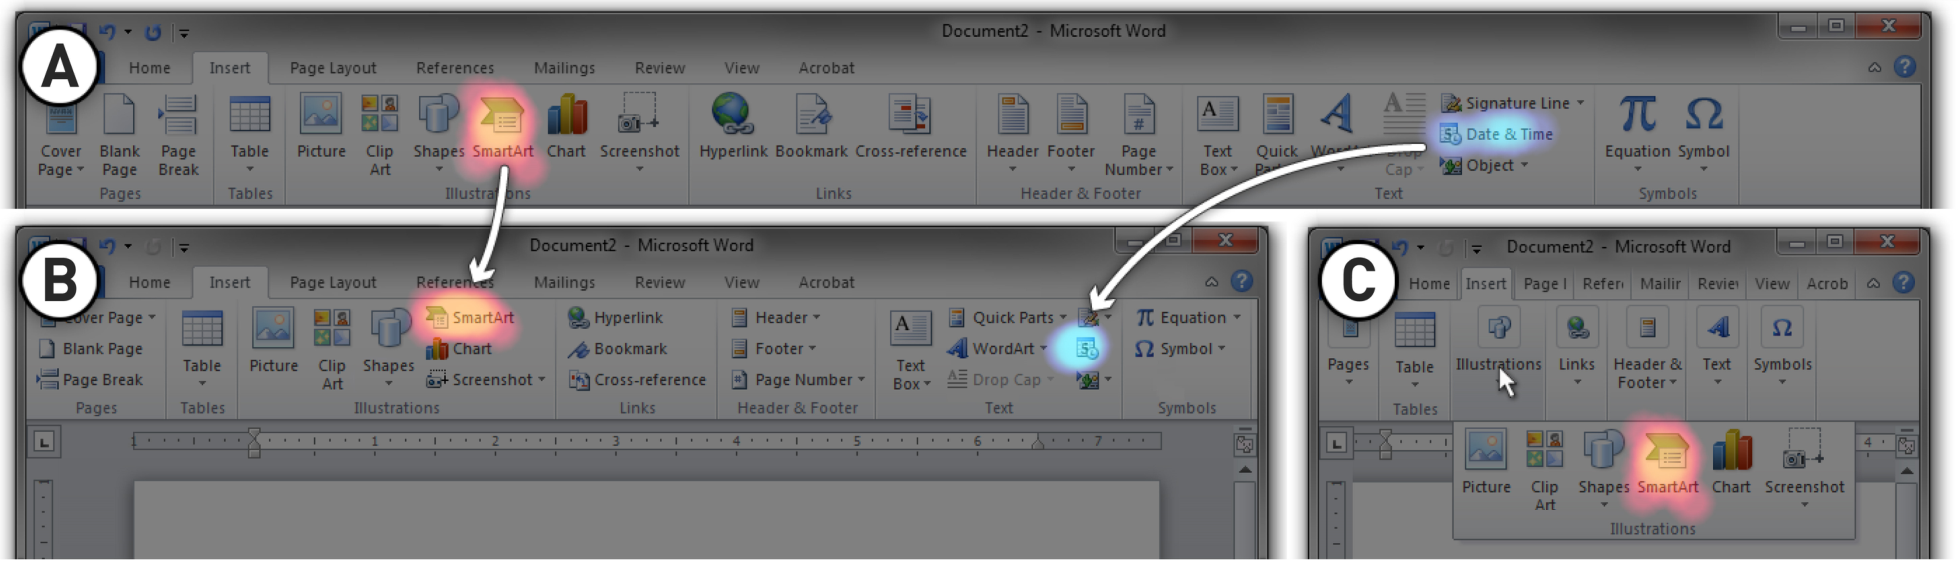
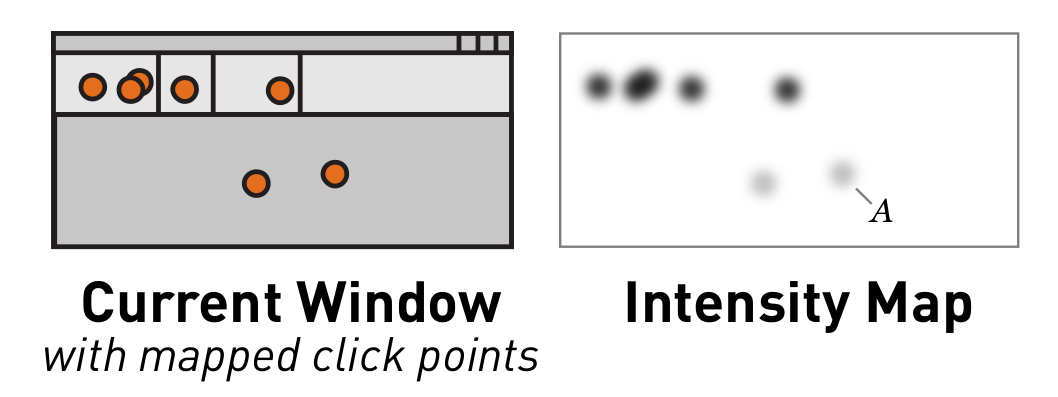
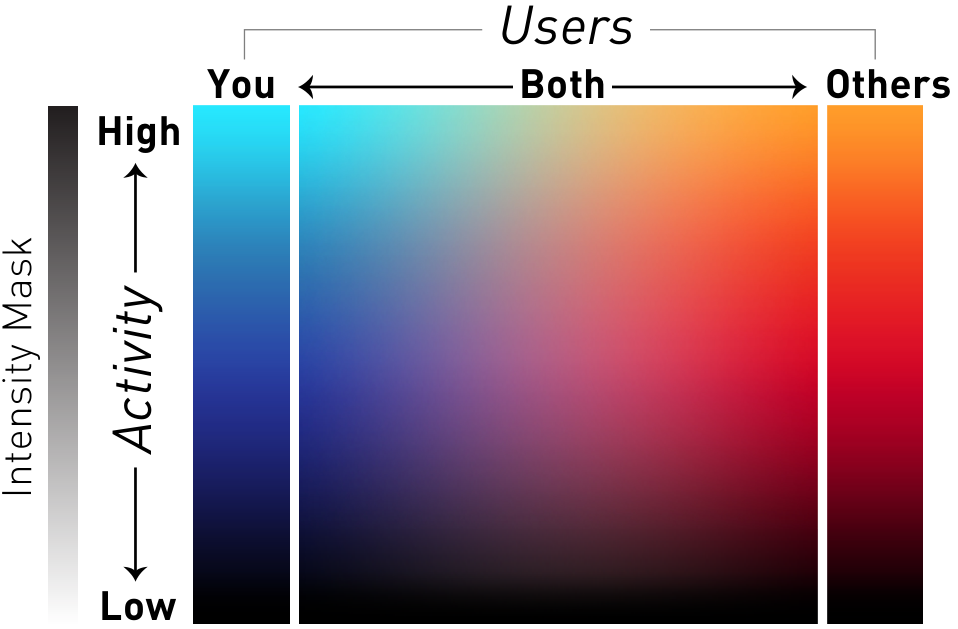
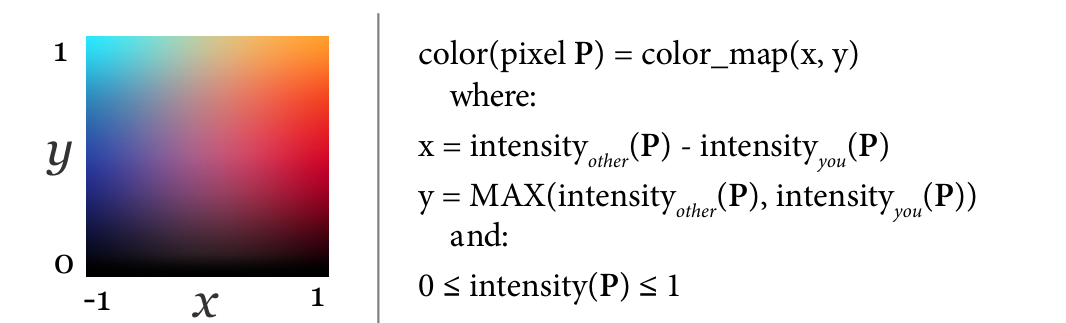
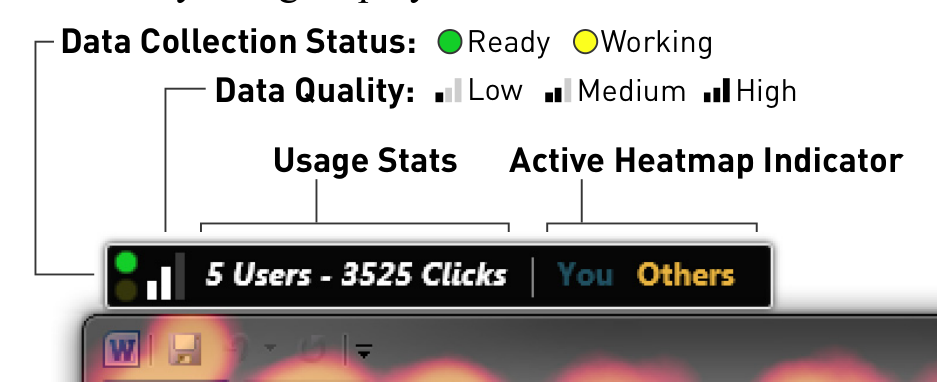
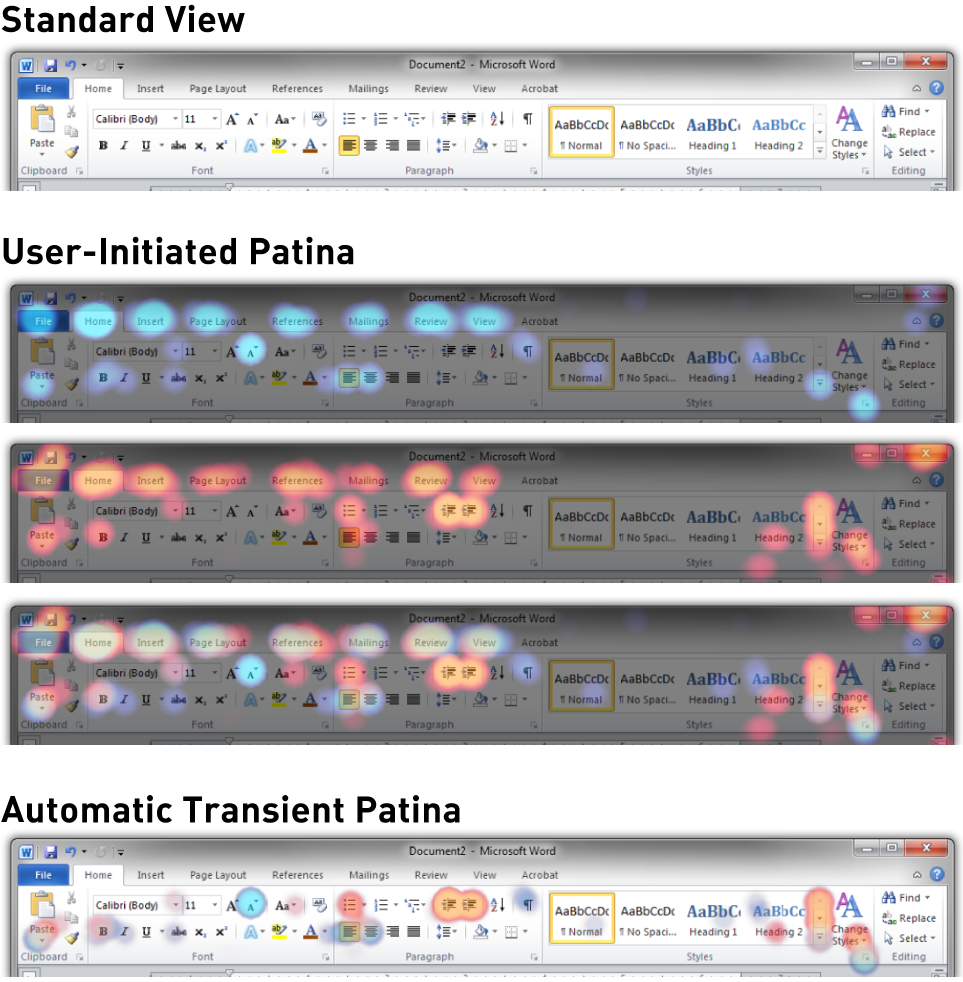
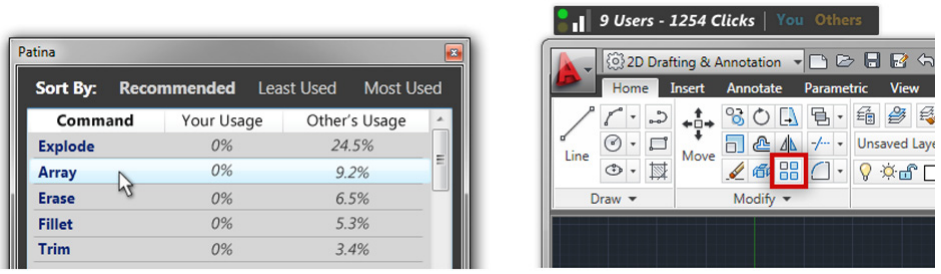
We present Patina, an application independent system for collecting and visualizing software application usage data. Patina requires no instrumentation of the target application, all data is collected through standard window metrics and accessibility APIs. The primary visualization is a dynamic heatmap overlay which adapts to match the content, location, and shape of the user interface controls visible in the active application. We discuss a set of design guidelines for the Patina system, describe our implementation of the system, and report on an initial evaluation based on a short-term deployment of the system.
Figures
BibTeX
@inproceedings{10.1145/2470654.2466442,
 abstract = {We present Patina, an application independent system for collecting and visualizing software application usage data. Patina requires no instrumentation of the target application, all data is collected through standard window metrics and accessibility APIs. The primary visualization is a dynamic heatmap overlay which adapts to match the content, location, and shape of the user interface controls visible in the active application. We discuss a set of design guidelines for the Patina system, describe our implementation of the system, and report on an initial evaluation based on a short-term deployment of the system.},
 address = {New York, NY, USA},
 author = {Matejka, Justin and Grossman, Tovi and Fitzmaurice, George},
 booktitle = {Proceedings of the SIGCHI Conference on Human Factors in Computing Systems},
 doi = {10.1145/2470654.2466442},
 isbn = {9781450318990},
 keywords = {social learning, visualization},
 location = {Paris, France},
 numpages = {10},
 pages = {3227–3236},
 publisher = {Association for Computing Machinery},
 series = {CHI '13},
 title = {Patina: Dynamic Heatmaps for Visualizing Application Usage},
 url = {https://doi.org/10.1145/2470654.2466442},
 year = {2013}
}