The Effect of Visual Appearance on the Performance of Continuous Sliders and Visual Analogue Scales
Abstract
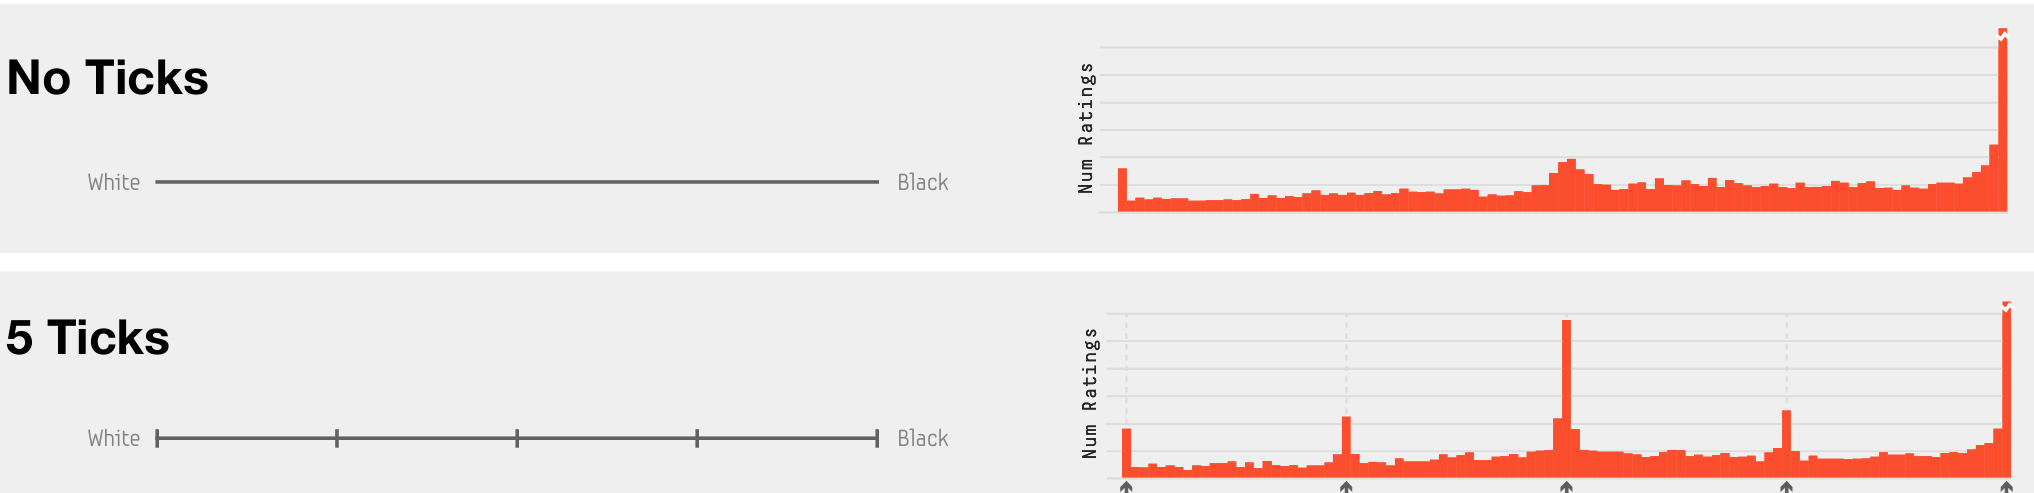
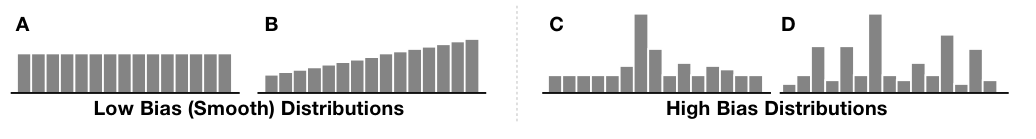
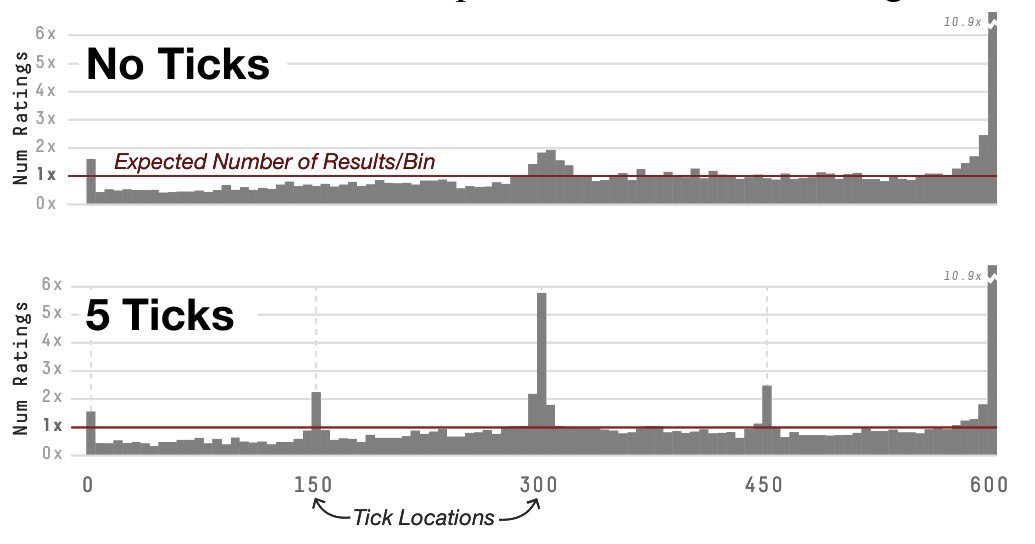
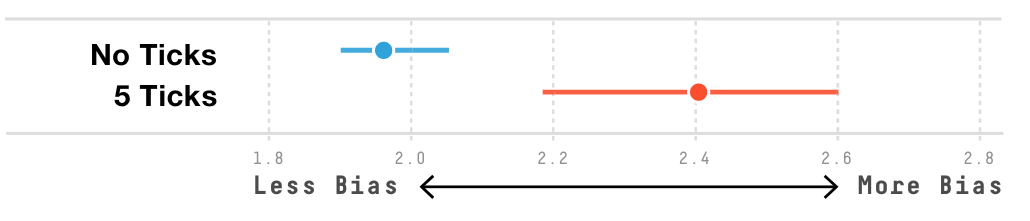
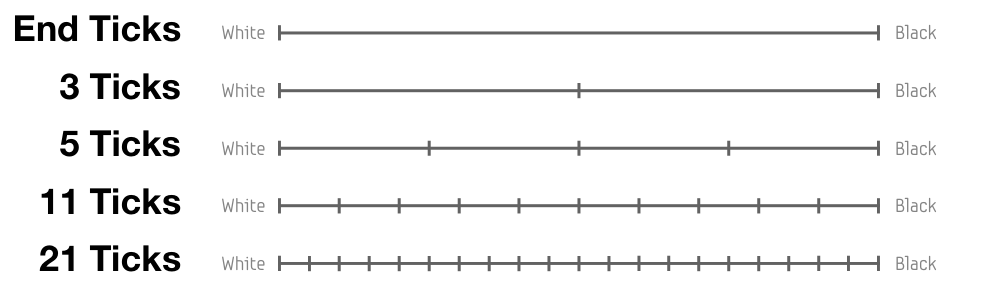
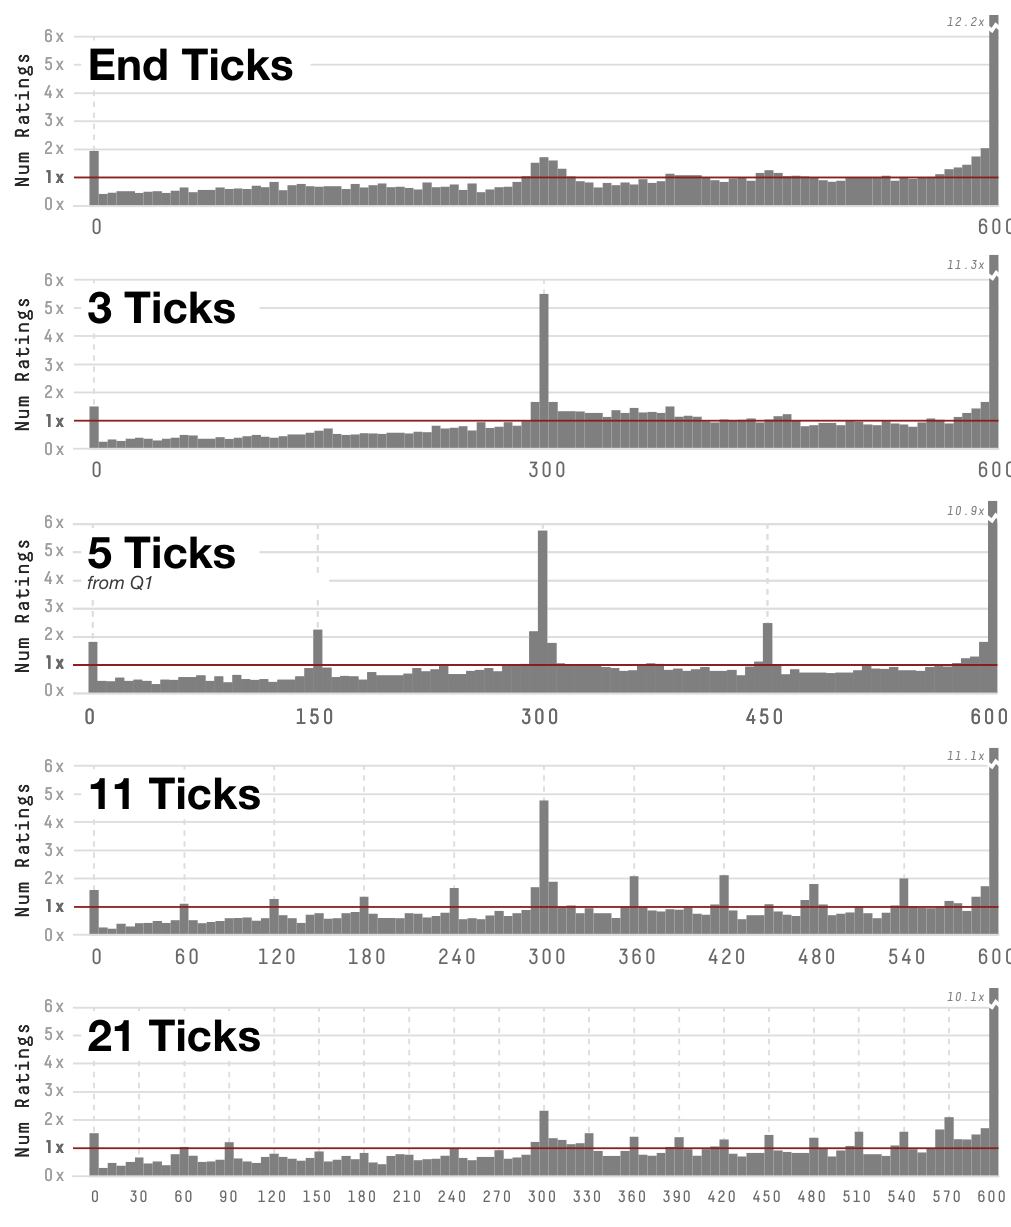
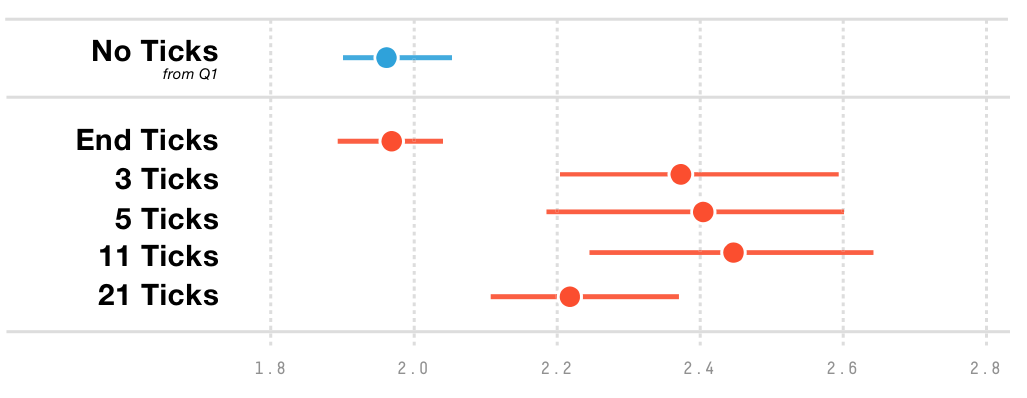
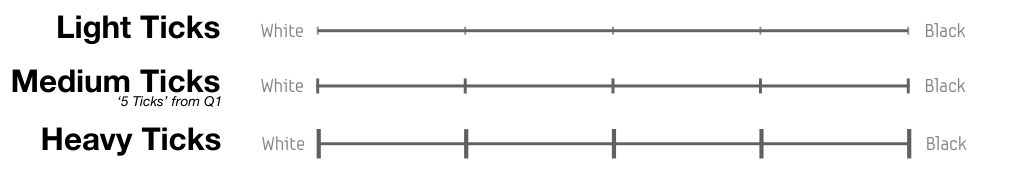
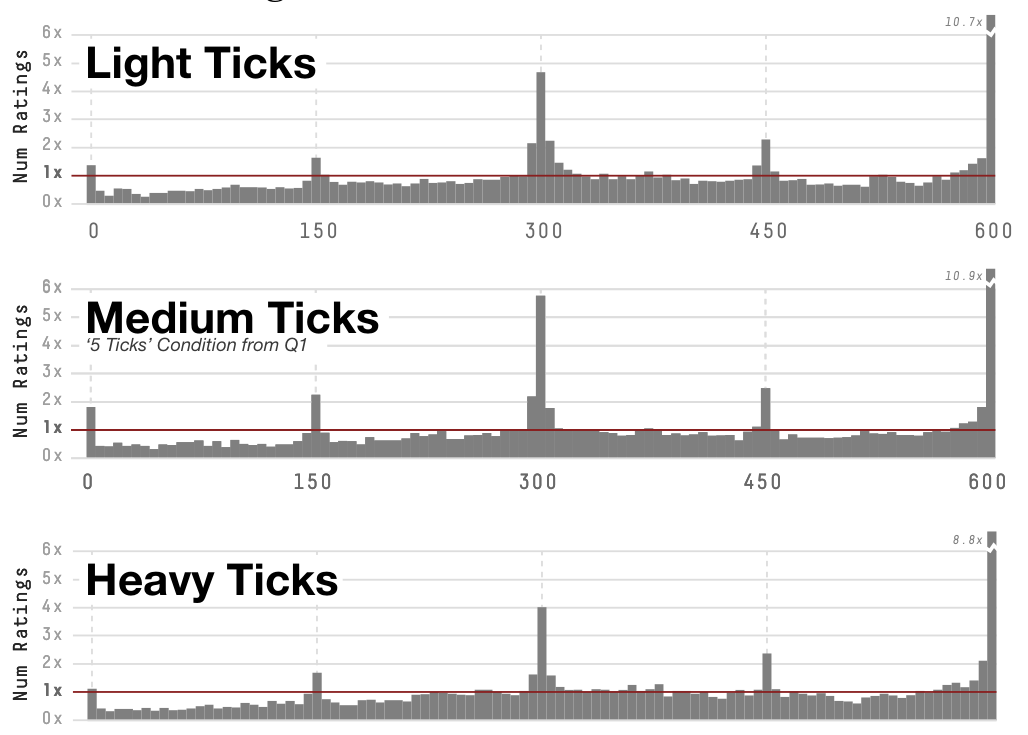
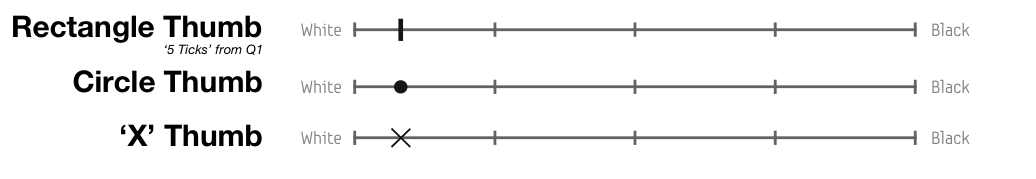
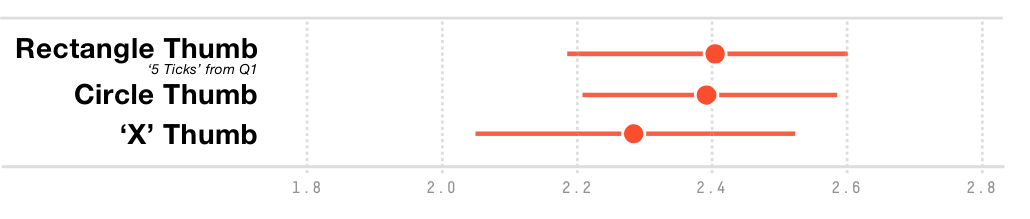
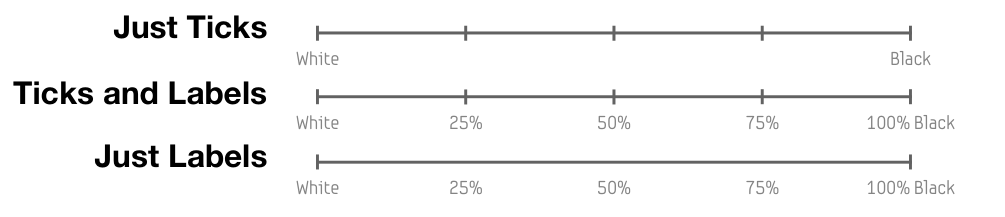
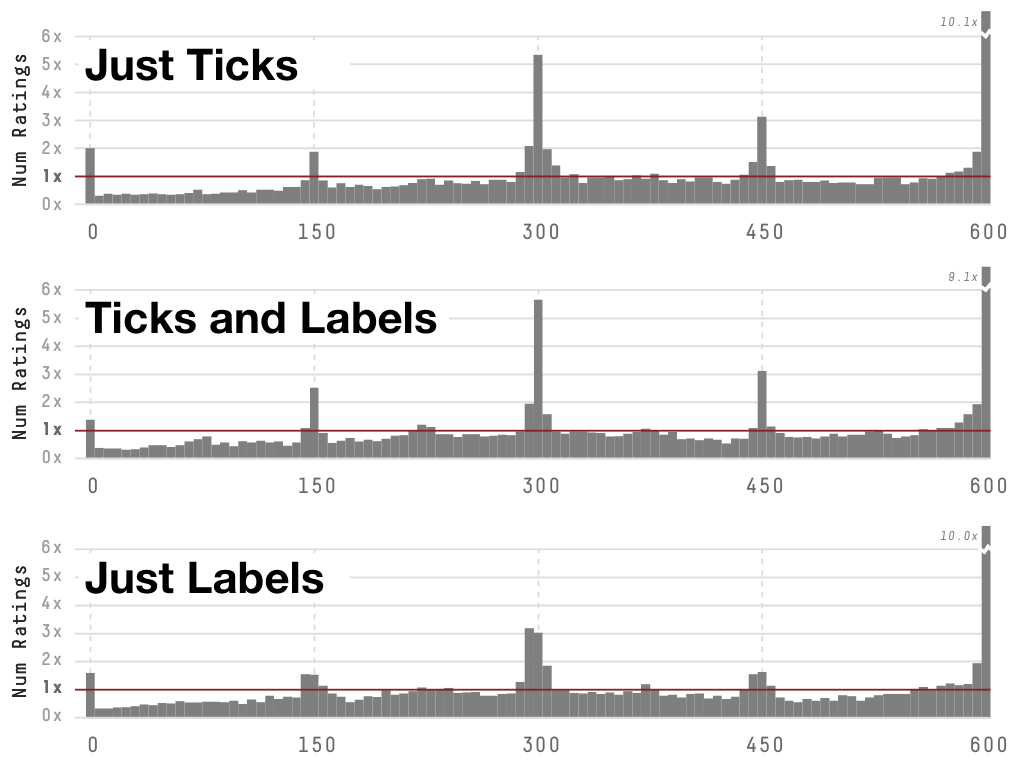
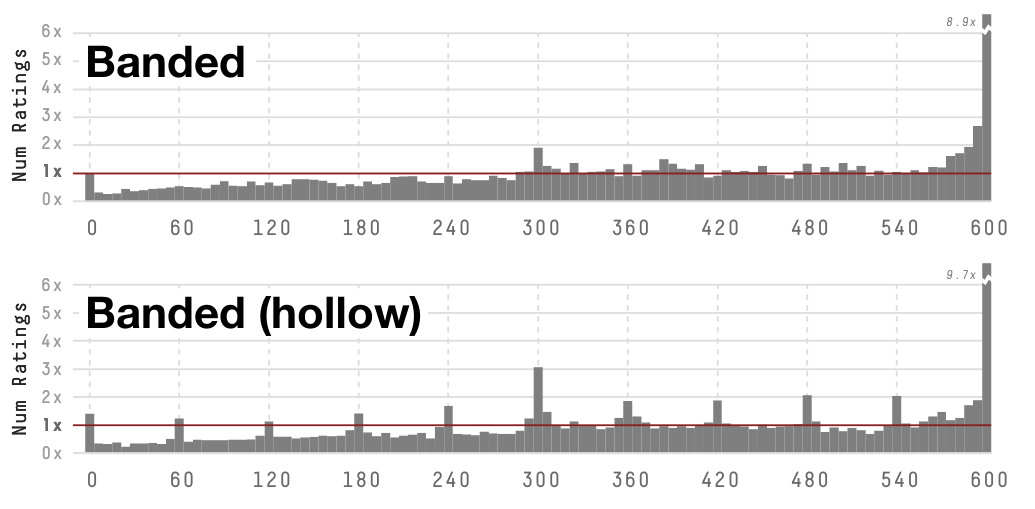
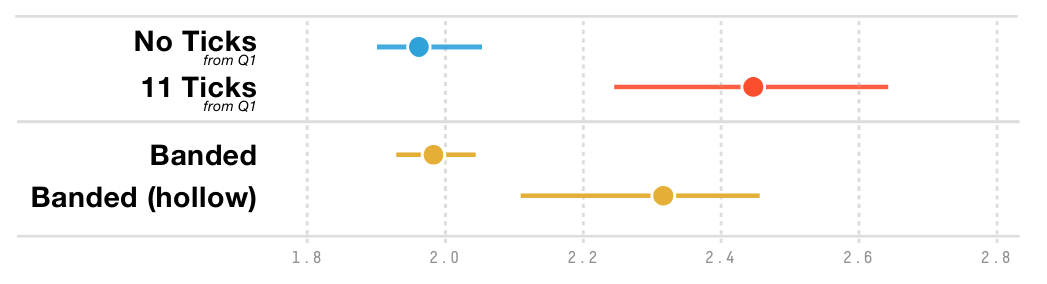
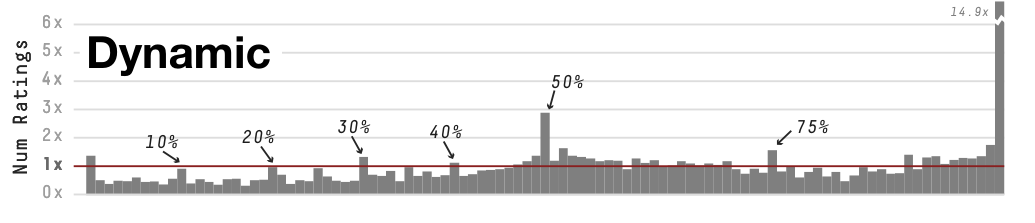
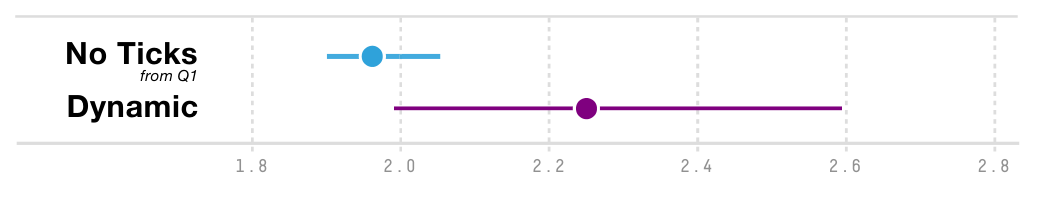
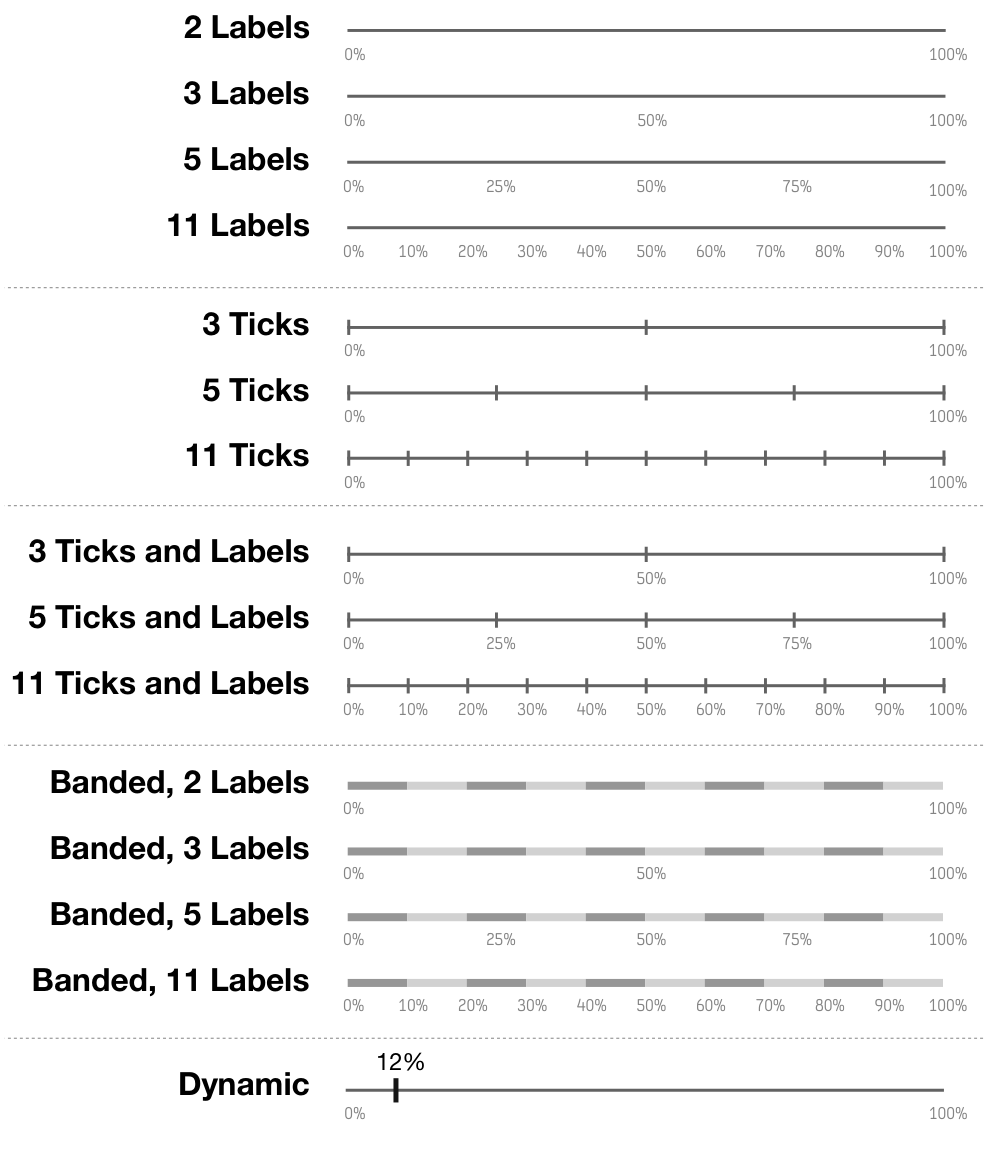
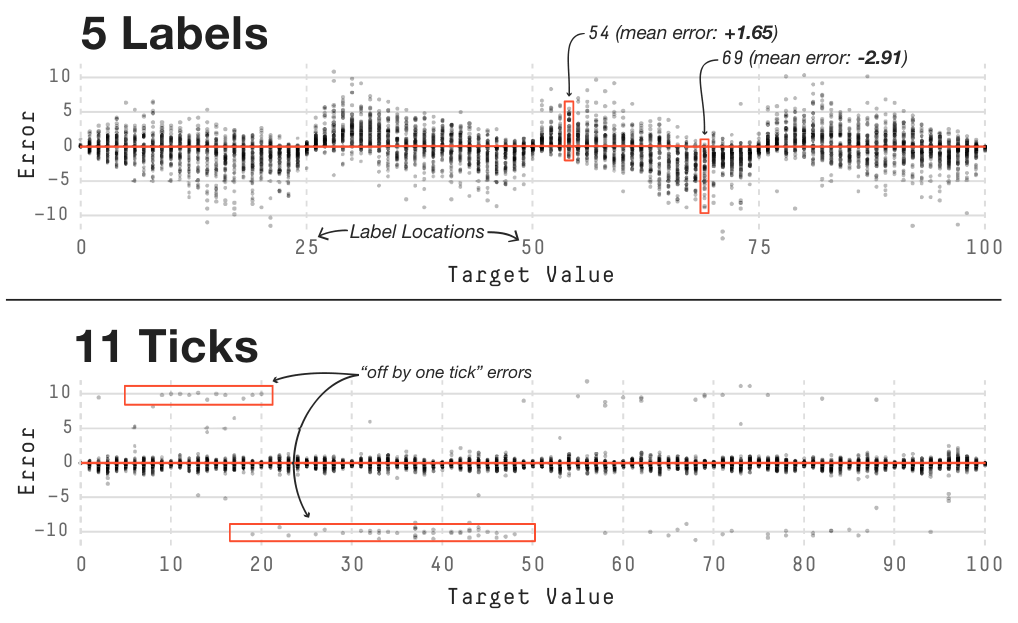
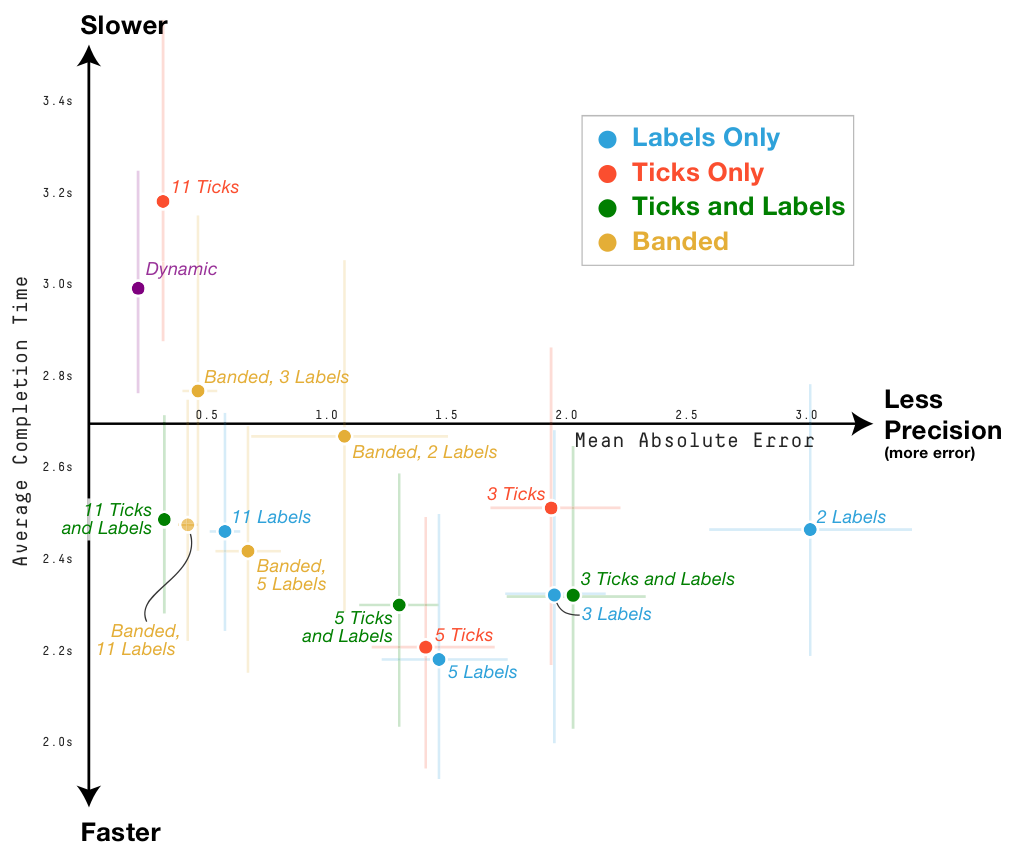
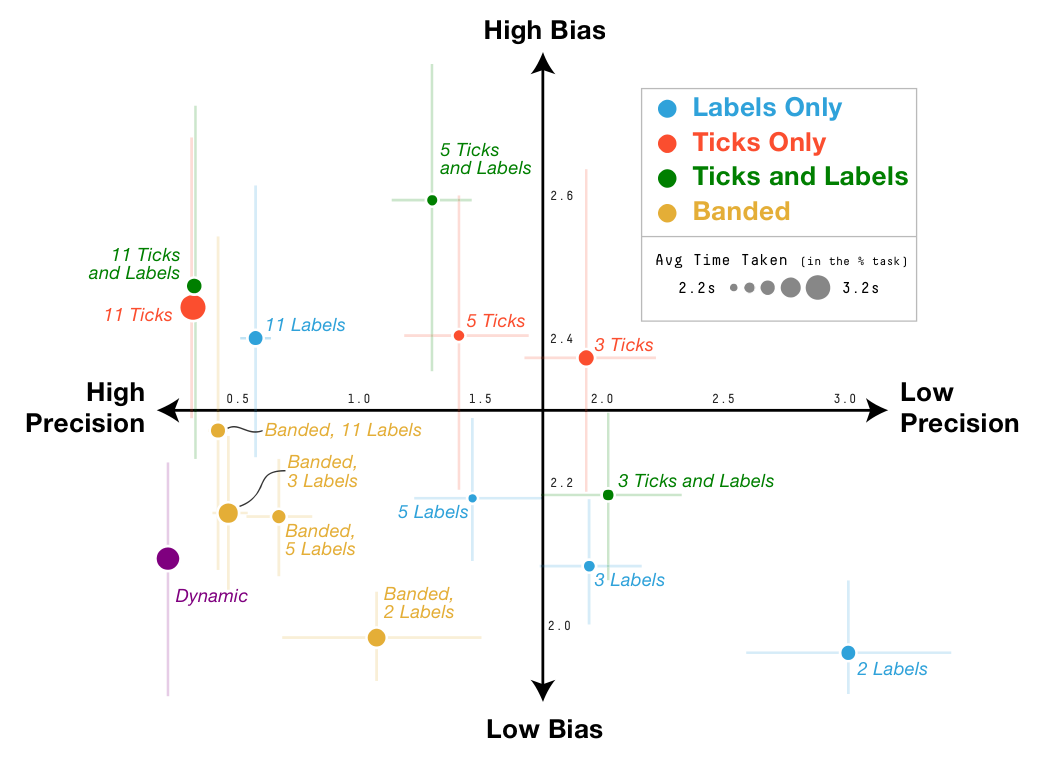
Sliders and Visual Analogue Scales (VASs) are input mechanisms which allow users to specify a value within a predefined range. At a minimum, sliders and VASs typically consist of a line with the extreme values labeled. Additional decorations such as labels and tick marks can be added to give information about the gradations along the scale and allow for more precise and repeatable selections. There is a rich history of research about the effect of labelling in discrete scales (i.e., Likert scales), however the effect of decorations on continuous scales has not been rigorously explored. In this paper we perform a 2,000 user, 250,000 trial online experiment to study the effects of slider appearance, and find that decorations along the slider considerably bias the distribution of responses received. Using two separate experimental tasks, the trade-offs between bias, accuracy, and speed-of-use are explored and design recommendations for optimal slider implementations are proposed.
Figures


BibTeX
@inproceedings{10.1145/2858036.2858063,
 abstract = {Sliders and Visual Analogue Scales (VASs) are input mechanisms which allow users to specify a value within a predefined range. At a minimum, sliders and VASs typically consist of a line with the extreme values labeled. Additional decorations such as labels and tick marks can be added to give information about the gradations along the scale and allow for more precise and repeatable selections. There is a rich history of research about the effect of labelling in discrete scales (i.e., Likert scales), however the effect of decorations on continuous scales has not been rigorously explored. In this paper we perform a 2,000 user, 250,000 trial online experiment to study the effects of slider appearance, and find that decorations along the slider considerably bias the distribution of responses received. Using two separate experimental tasks, the trade-offs between bias, accuracy, and speed-of-use are explored and design recommendations for optimal slider implementations are proposed.},
 address = {New York, NY, USA},
 author = {Matejka, Justin and Glueck, Michael and Grossman, Tovi and Fitzmaurice, George},
 booktitle = {Proceedings of the 2016 CHI Conference on Human Factors in Computing Systems},
 doi = {10.1145/2858036.2858063},
 isbn = {9781450333627},
 keywords = {visual analogue scales, slider, crowdsourced study, tick marks},
 location = {San Jose, California, USA},
 numpages = {12},
 pages = {5421–5432},
 publisher = {Association for Computing Machinery},
 series = {CHI '16},
 title = {The Effect of Visual Appearance on the Performance of Continuous Sliders and Visual Analogue Scales},
 url = {https://doi.org/10.1145/2858036.2858063},
 year = {2016}
}