To Use or Not to Use: Impatience and Overreliance When Using Generative AI Productivity Support Tools
Abstract
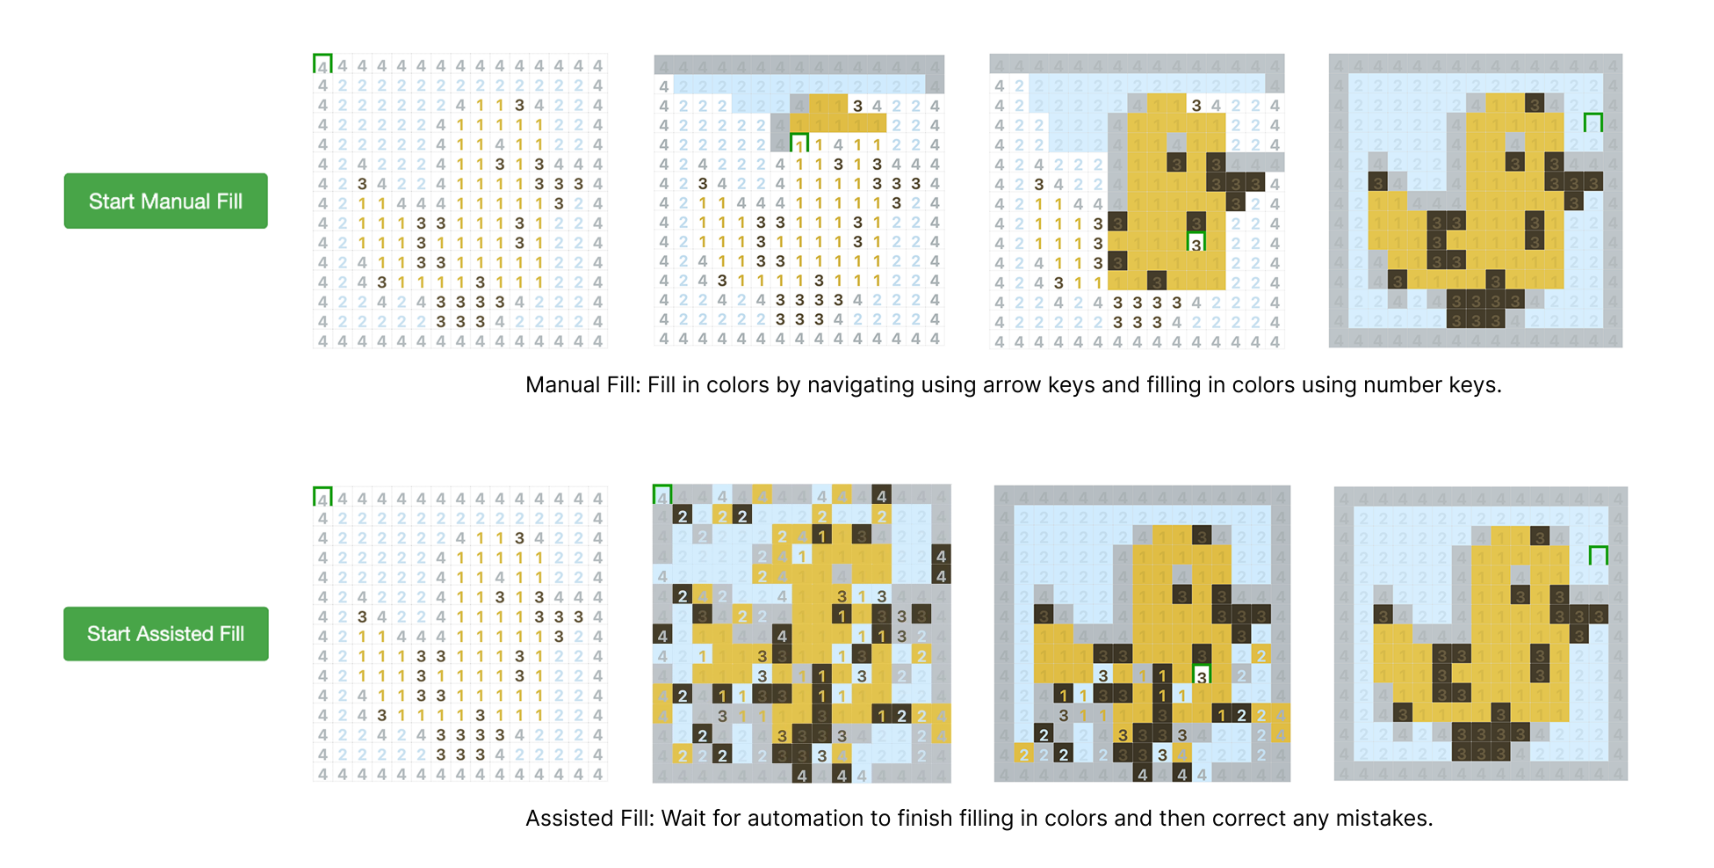
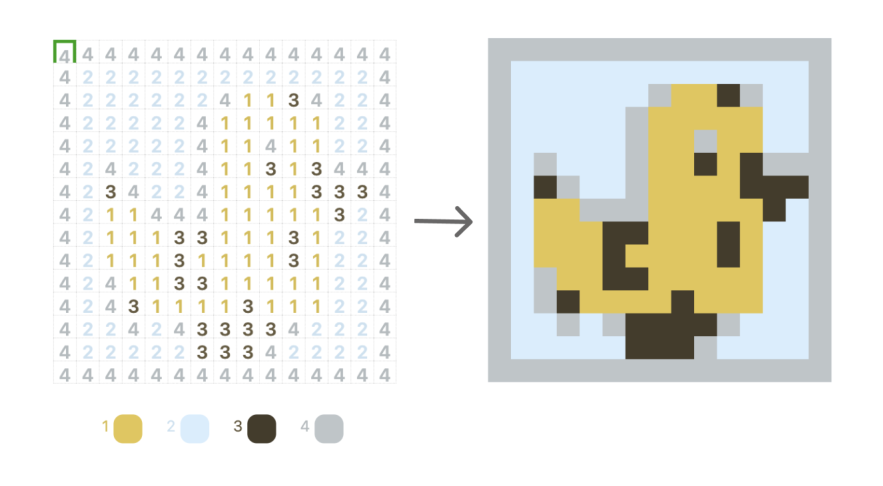
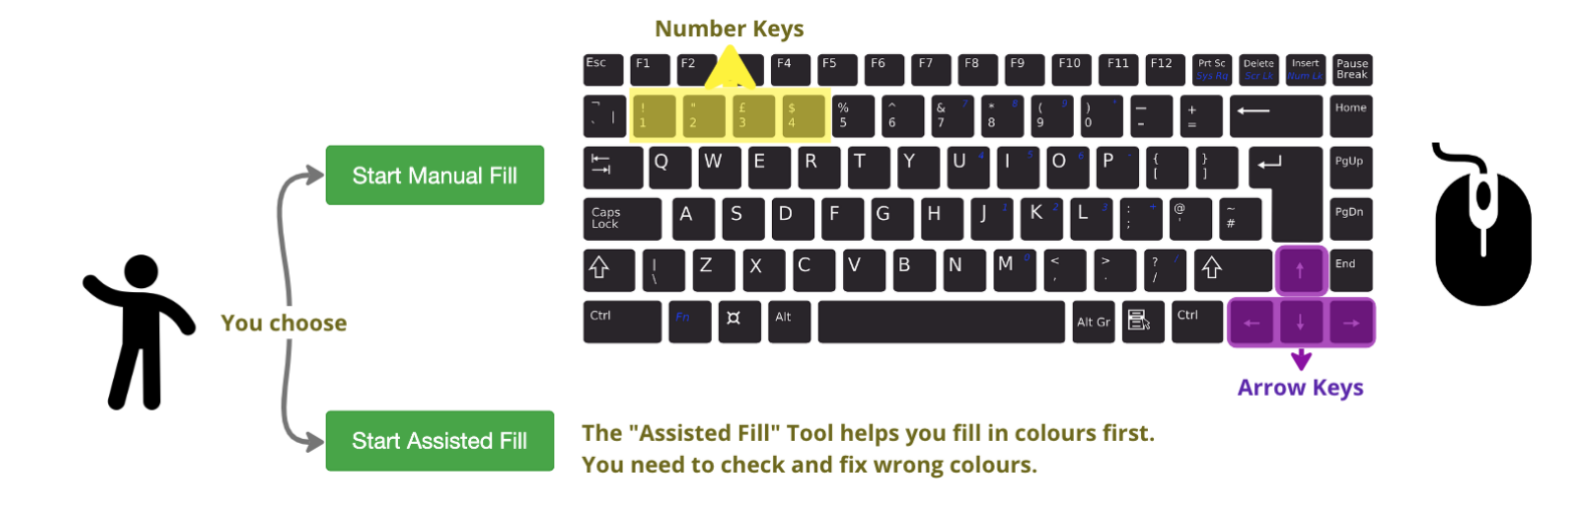
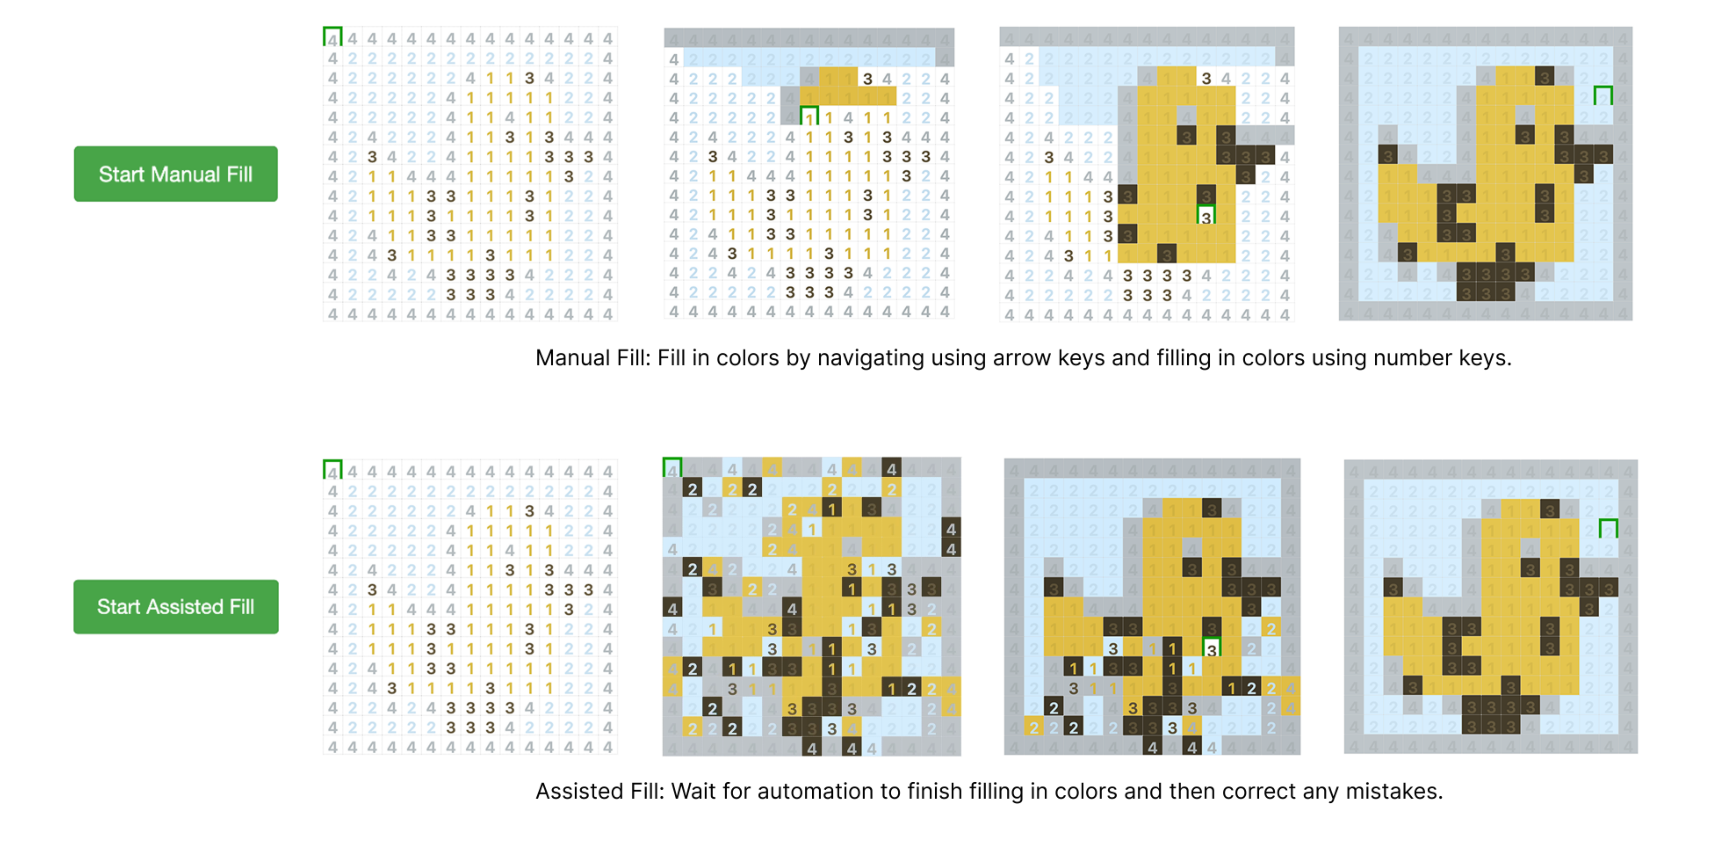
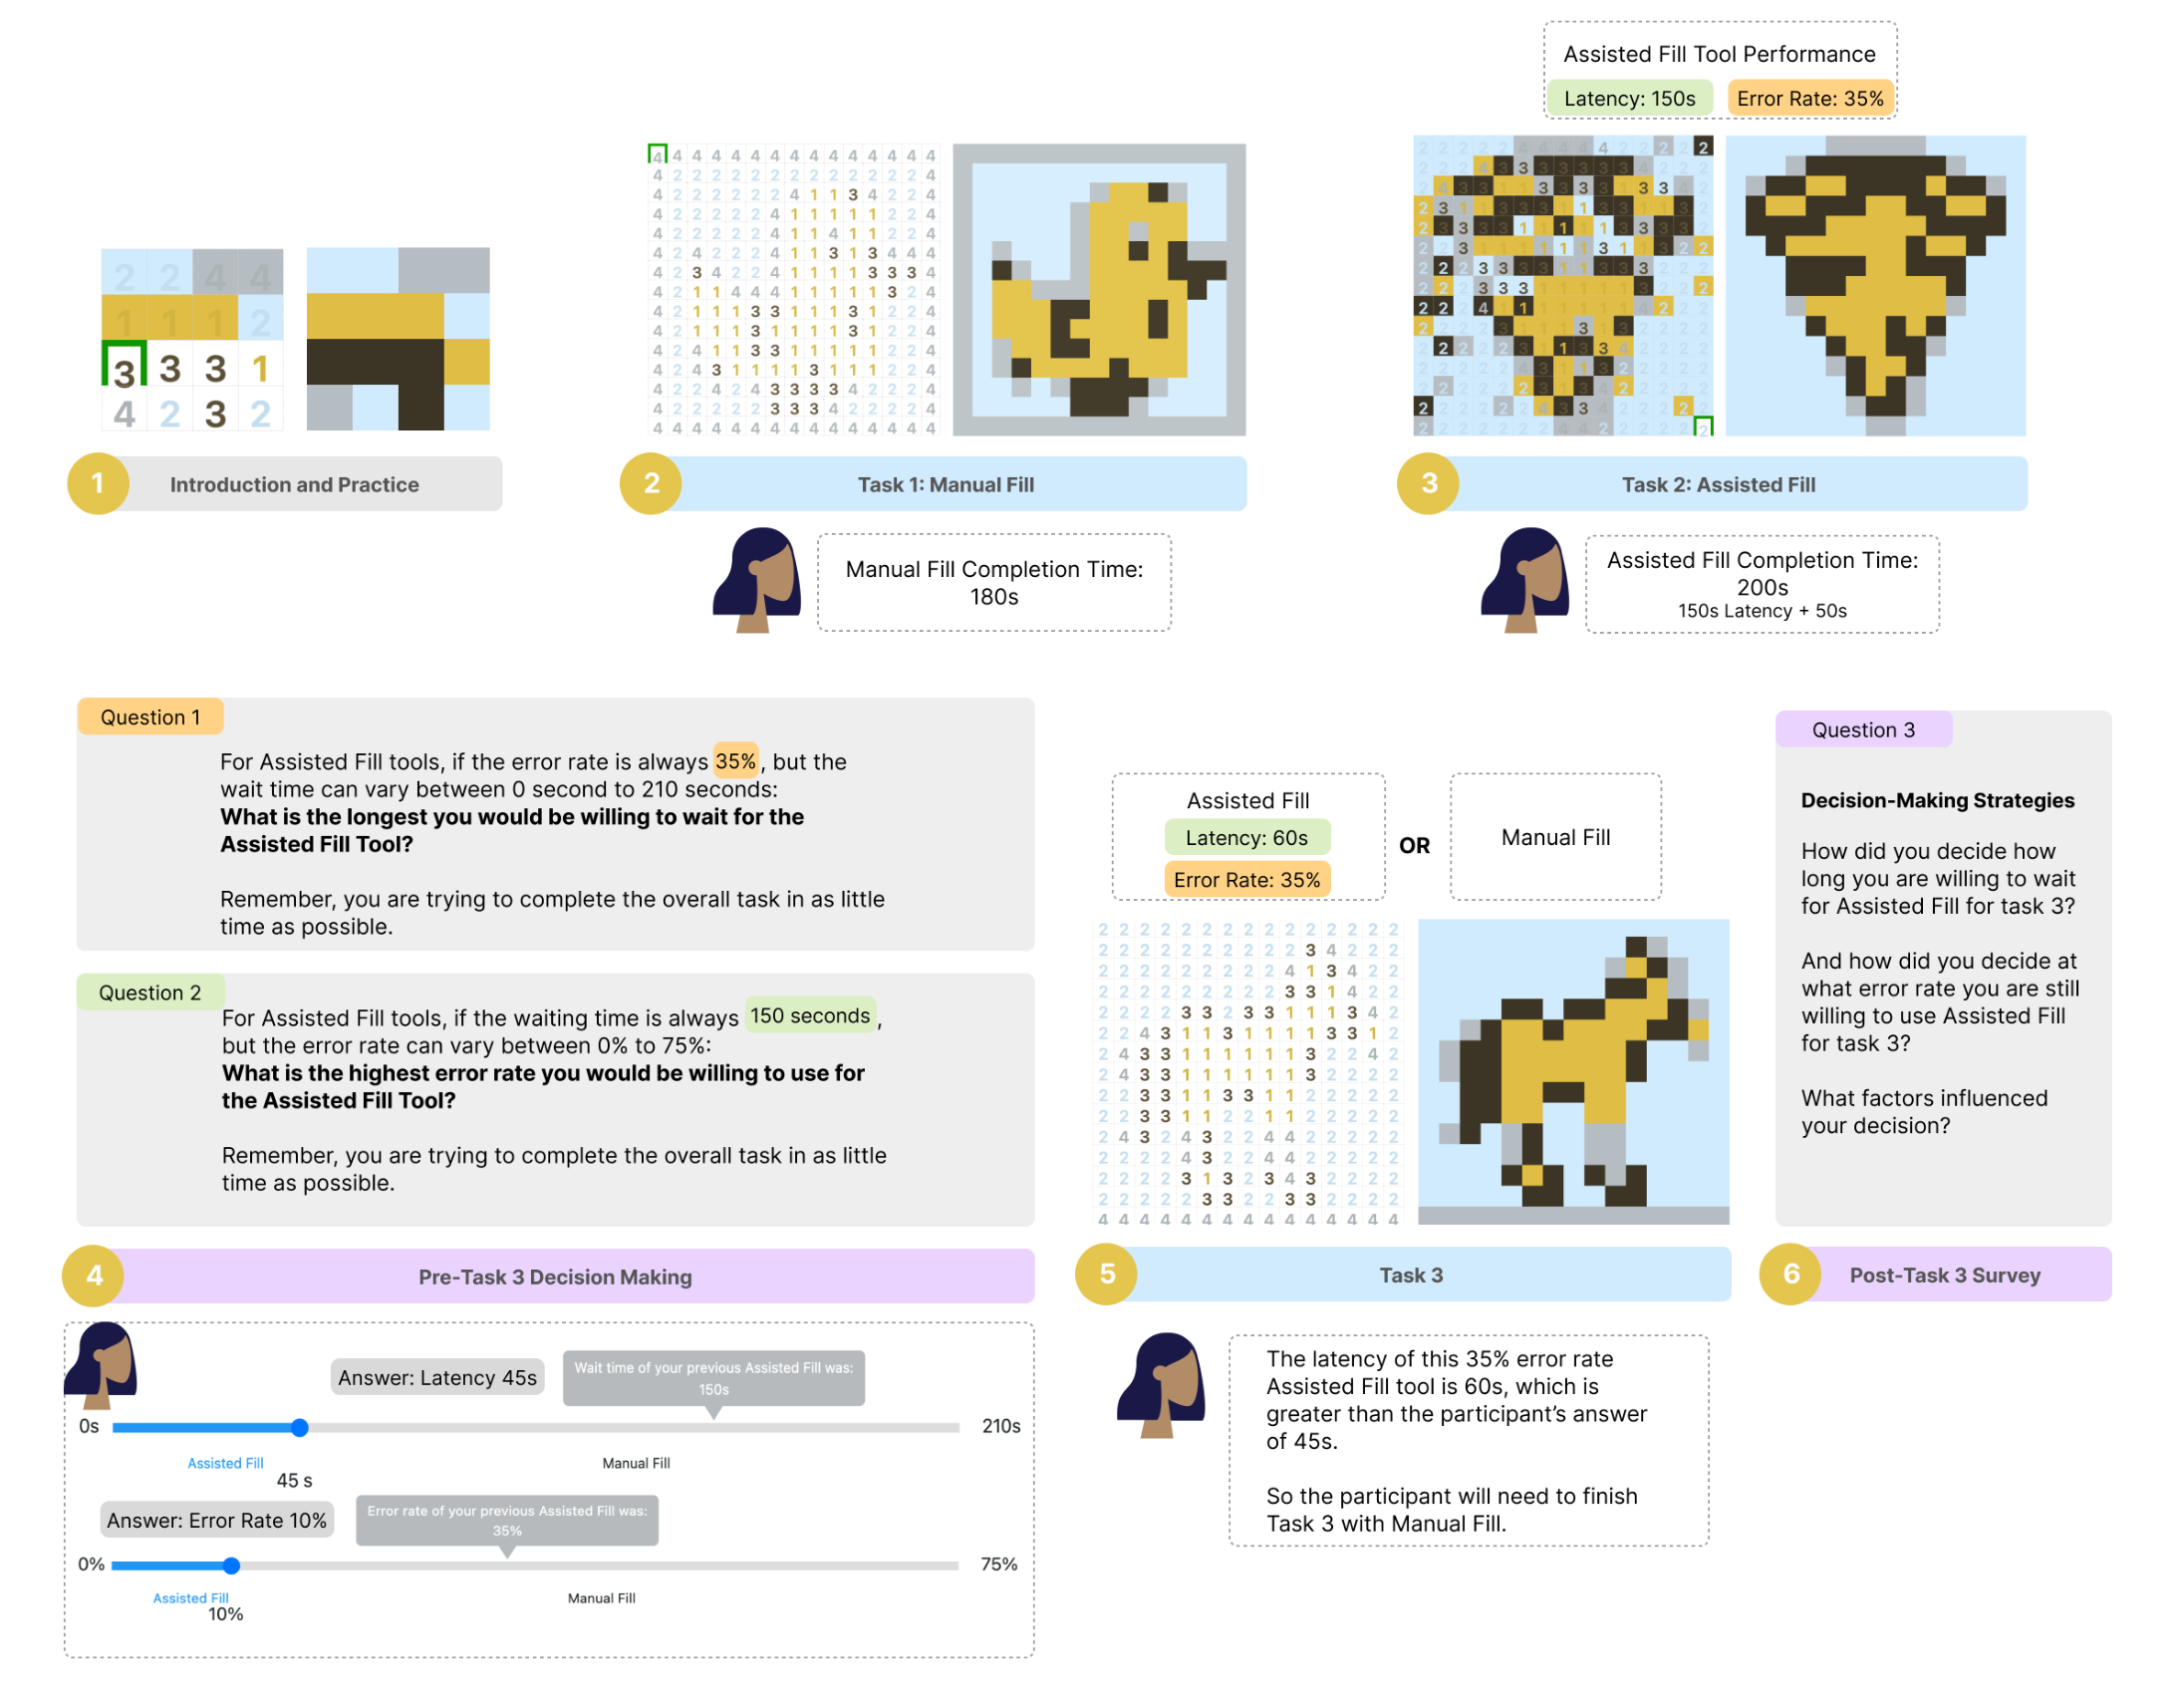
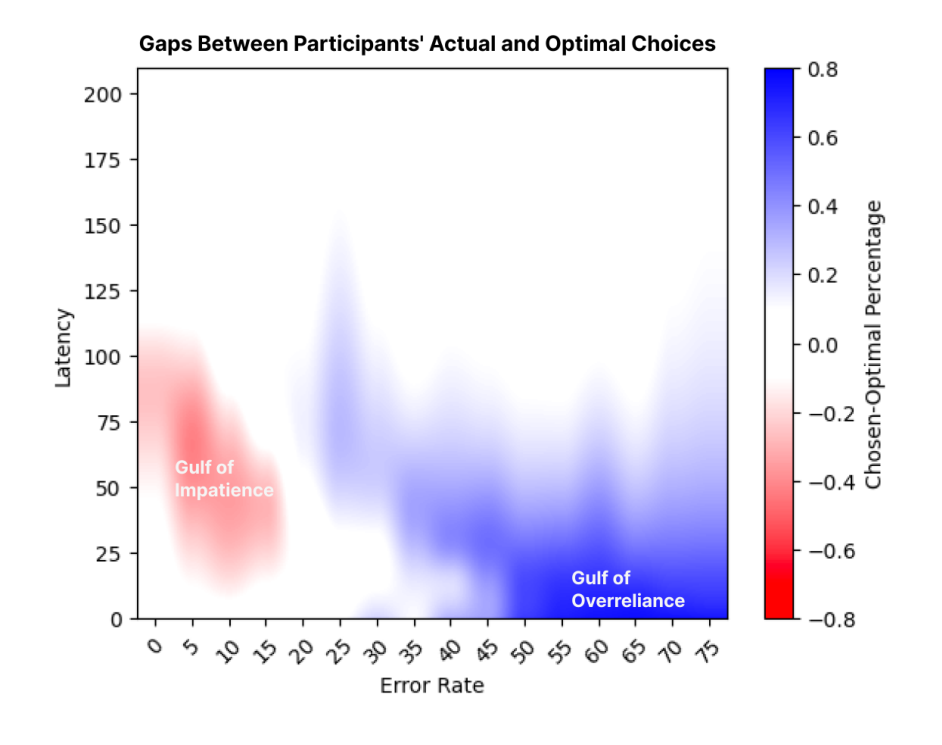
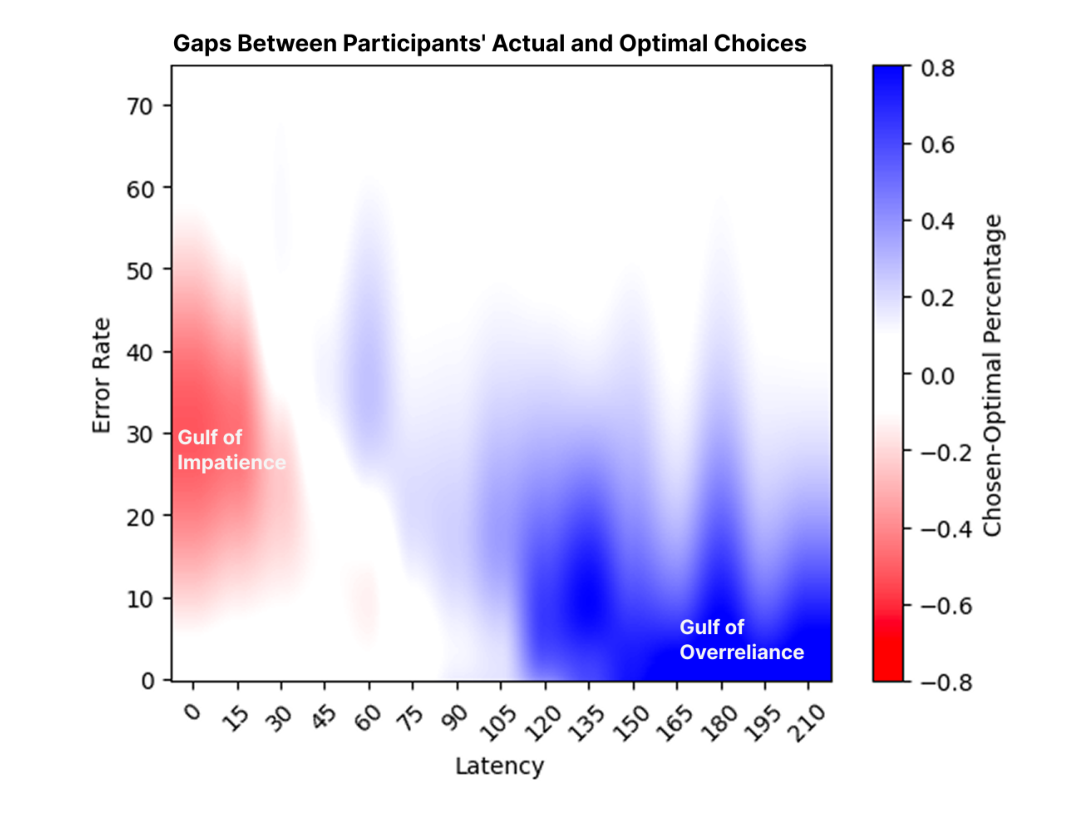
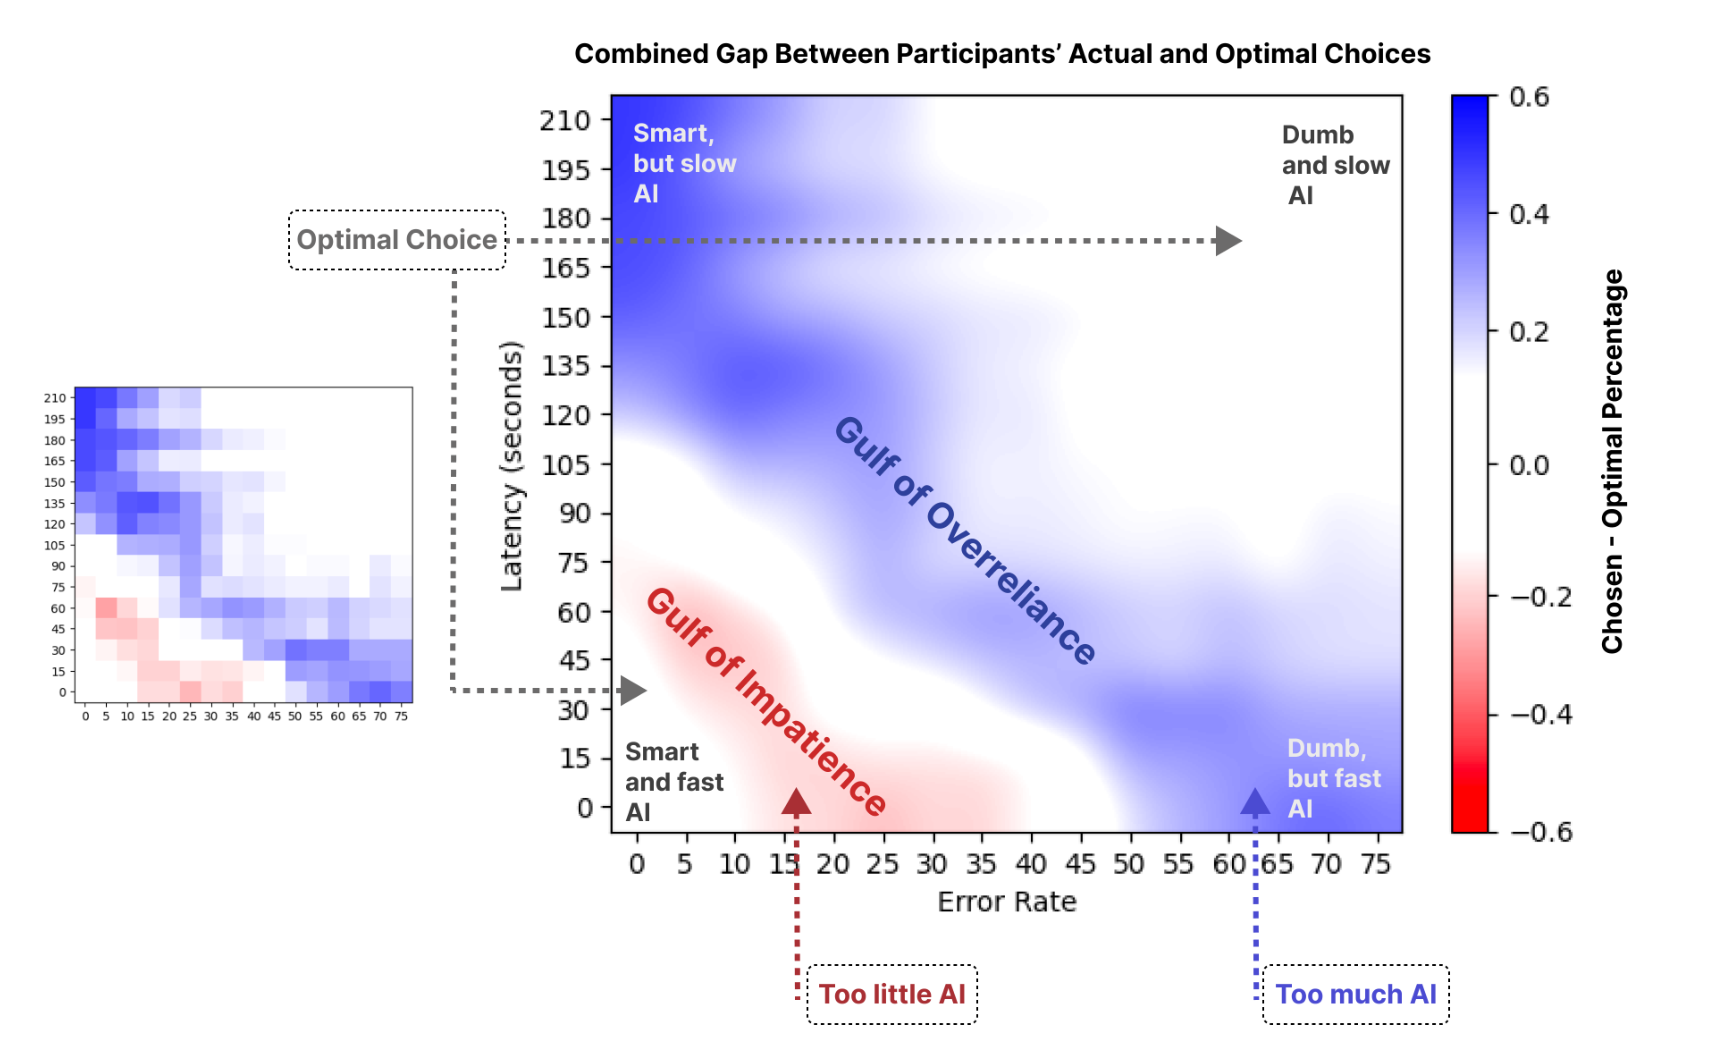
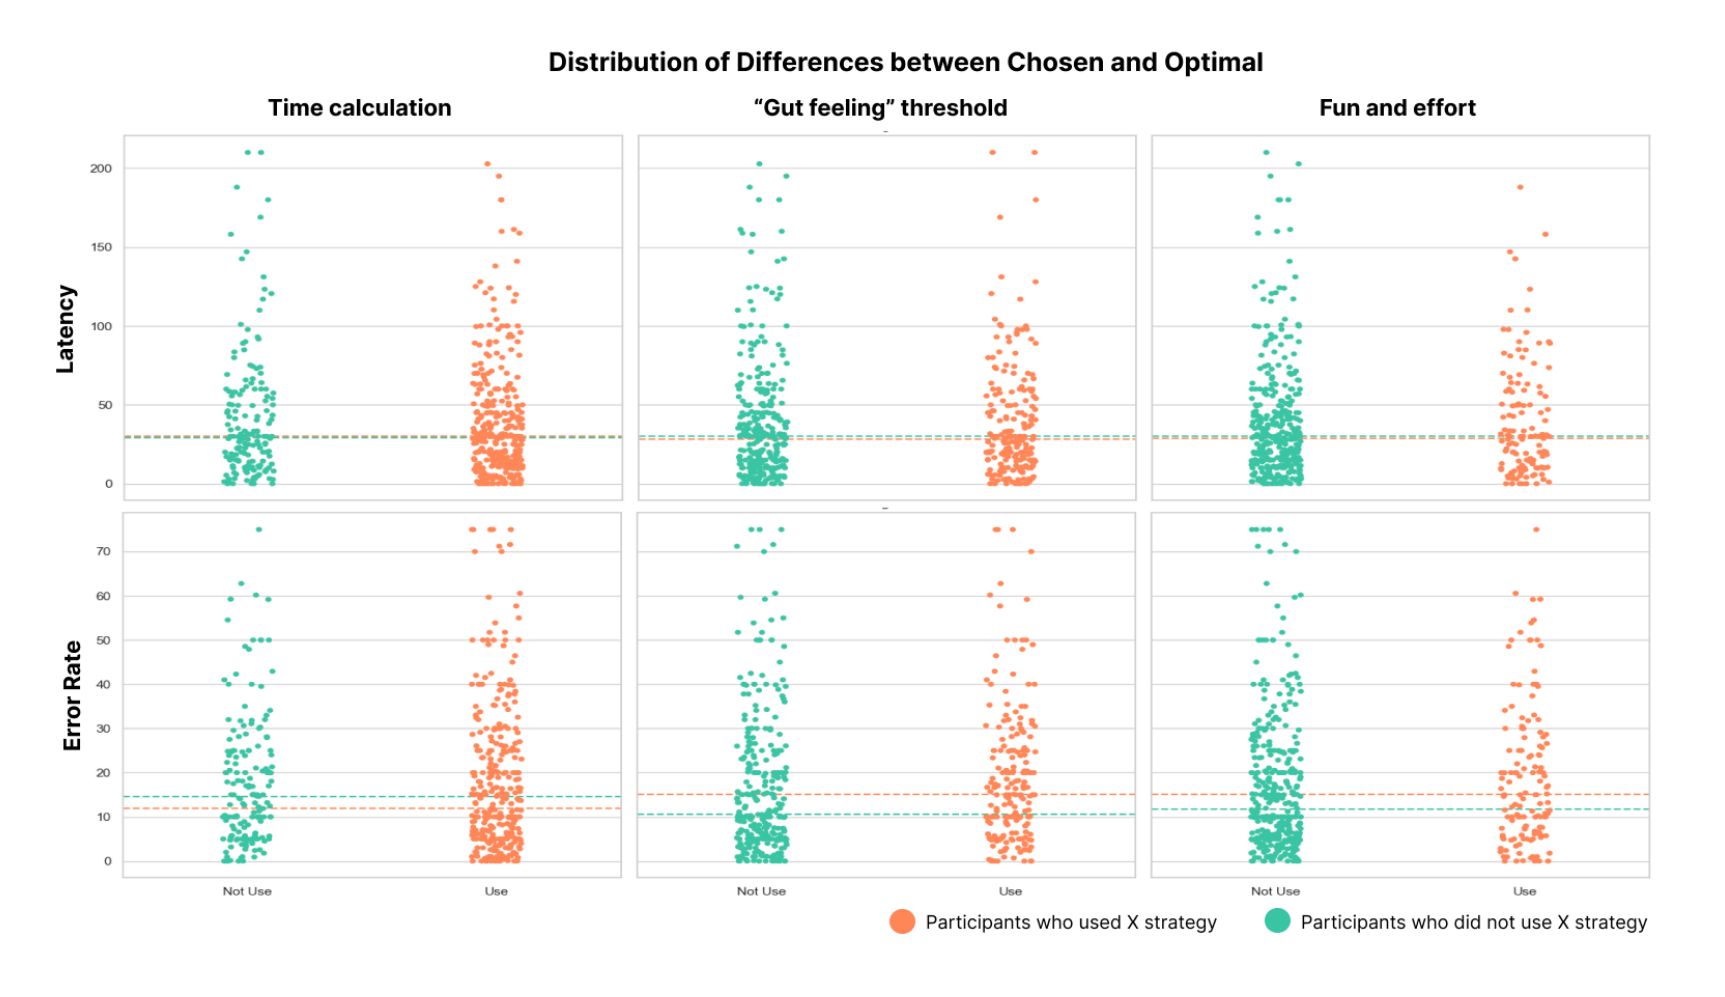
Generative AI has the potential to assist people with completing various tasks, but increased productivity is not guaranteed due to challenges such as uncertainty in output quality and unclear processing time. Through an online crowdsourced experiment (N=508), leveraging a “paint by numbers” task to simulate properties of GenAI assistance, we explore how, and how well, users make decisions on whether to use or not use automation to maximize their productivity given varying waiting times and output quality. We observed gaps between user’s actual choices and their optimal choices and characterized these gaps as the “gulf of impatience” and the “gulf of overreliance”. We also distilled strategies that participants adopted when making their decisions. We discuss design considerations in supporting users to make more informed decisions when interacting with GenAI tools and make these tools more useful for improving users’ task performance, productivity and satisfaction.
Figures
![Figure 6: Four plots illustrating the main patterns of chosen versus optimal percentages of using Assisted Fill given various error rate conditions. The y-axis in each chart represents the percentage of participants choosing Assisted Fill, with y = 1 meaning everyone chose Assisted Fill and y = 0 indicating no one chose Assisted Fill. The x-axis represents the different latency conditions. The charts represent these variables for increasing error rates: 0% (top left), 20% (top right), 50% (bottom left), and 75% (bottom right). Sigmoid curves are fitted to the raw data to illustrate trends. Shaded areas around the red and blue curves represent 1-sigma bootstrap confidence intervals [8, 40].](/publication/to-use-or-not-to-use-impatience-and/figure-6-cropped.png)
![Figure 8: Four plots illustrating key patterns in chosen versus optimal percentages of using Assisted Fill given various latency conditions. The y-axis in each chart represents the percentage of participants choosing Assisted Fill, with y = 1 meaning everyone chose Assisted Fill and y = 0 indicating no one chose Assisted Fill. The x-axis represents the different error rate conditions. The four horizontal charts represent these variables for increasing latency: 0s (top left), 30s (top right), 105s (bottom left), and 210s (bottom right). Sigmoid curves are fitted to the raw data to illustrate trends. Shaded areas around the red and blue curves represent 1-sigma bootstrap confidence intervals [8, 40].](/publication/to-use-or-not-to-use-impatience-and/figure-8-cropped.png)
BibTeX
@inproceedings{10.1145/3706598.3714103,
author = {Qiao, Han and Vermeulen, Jo and Fitzmaurice, George and Matejka, Justin},
title = {To Use or Not to Use: Impatience and Overreliance When Using Generative AI Productivity Support Tools},
year = {2025},
isbn = {9798400713941},
publisher = {Association for Computing Machinery},
address = {New York, NY, USA},
url = {https://doi.org/10.1145/3706598.3714103},
doi = {10.1145/3706598.3714103},
abstract = {Generative AI has the potential to assist people with completing various tasks, but increased productivity is not guaranteed due to challenges such as uncertainty in output quality and unclear processing time. Through an online crowdsourced experiment (N=508), leveraging a “paint by numbers” task to simulate properties of GenAI assistance, we explore how, and how well, users make decisions on whether to use or not use automation to maximize their productivity given varying waiting times and output quality. We observed gaps between user’s actual choices and their optimal choices and characterized these gaps as the “gulf of impatience” and the “gulf of overreliance”. We also distilled strategies that participants adopted when making their decisions. We discuss design considerations in supporting users to make more informed decisions when interacting with GenAI tools and make these tools more useful for improving users’ task performance, productivity and satisfaction.},
booktitle = {Proceedings of the 2025 CHI Conference on Human Factors in Computing Systems},
articleno = {1122},
numpages = {18},
keywords = {generative AI, decision-making, productivity, reliance, AI, automation, controlled experiment},
location = {
},
series = {CHI '25}
}